EXHIBIT 99.2
Published on May 14, 2026
| Hyperion DeFi © 2026 1 HYPD Q1 2026 Earnings Supplement More than just HYPE. NASDAQ: HYPD |
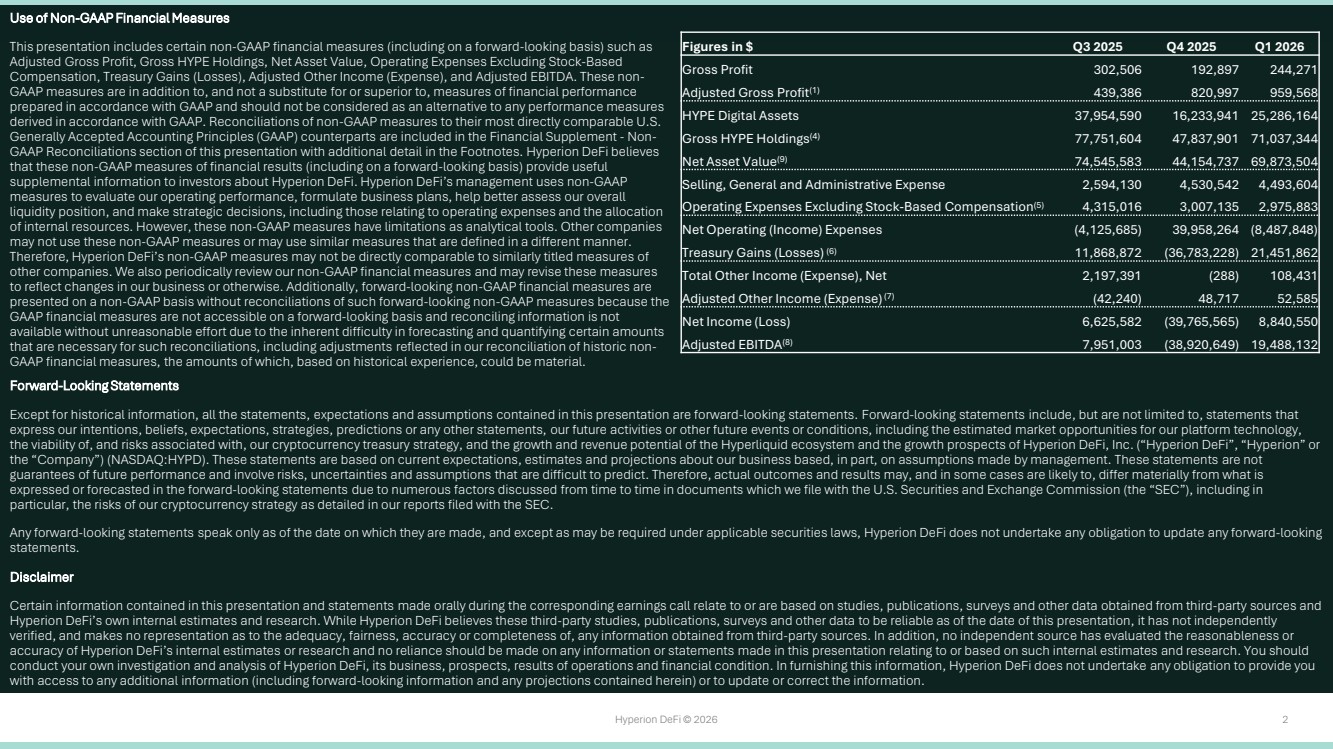
| Hyperion DeFi © 2026 2 Use of Non-GAAP Financial Measures This presentation includes certain non-GAAP financial measures (including on a forward-looking basis) such as Adjusted Gross Profit, Gross HYPE Holdings, Net Asset Value, Operating Expenses Excluding Stock-Based Compensation, Treasury Gains (Losses), Adjusted Other Income (Expense), and Adjusted EBITDA. These non-GAAP measures are in addition to, and not a substitute for or superior to, measures of financial performance prepared in accordance with GAAP and should not be considered as an alternative to any performance measures derived in accordance with GAAP. Reconciliations of non-GAAP measures to their most directly comparable U.S. Generally Accepted Accounting Principles (GAAP) counterparts are included in the Financial Supplement - Non-GAAP Reconciliations section of this presentation with additional detail in the Footnotes. Hyperion DeFi believes that these non-GAAP measures of financial results (including on a forward-looking basis) provide useful supplemental information to investors about Hyperion DeFi. Hyperion DeFi’s management uses non-GAAP measures to evaluate our operating performance, formulate business plans, help better assess our overall liquidity position, and make strategic decisions, including those relating to operating expenses and the allocation of internal resources. However, these non-GAAP measures have limitations as analytical tools. Other companies may not use these non-GAAP measures or may use similar measures that are defined in a different manner. Therefore, Hyperion DeFi’s non-GAAP measures may not be directly comparable to similarly titled measures of other companies. We also periodically review our non-GAAP financial measures and may revise these measures to reflect changes in our business or otherwise. Additionally, forward-looking non-GAAP financial measures are presented on a non-GAAP basis without reconciliations of such forward-looking non-GAAP measures because the GAAP financial measures are not accessible on a forward-looking basis and reconciling information is not available without unreasonable effort due to the inherent difficulty in forecasting and quantifying certain amounts that are necessary for such reconciliations, including adjustments reflected in our reconciliation of historic non-GAAP financial measures, the amounts of which, based on historical experience, could be material. Forward-Looking Statements Except for historical information, all the statements, expectations and assumptions contained in this presentation are forward-looking statements. Forward-looking statements include, but are not limited to, statements that express our intentions, beliefs, expectations, strategies, predictions or any other statements, our future activities or other future events or conditions, including the estimated market opportunities for our platform technology, the viability of, and risks associated with, our cryptocurrency treasury strategy, and the growth and revenue potential of the Hyperliquid ecosystem and the growth prospects of Hyperion DeFi, Inc. (“Hyperion DeFi”, “Hyperion” or the “Company”) (NASDAQ:HYPD). These statements are based on current expectations, estimates and projections about our business based, in part, on assumptions made by management. These statements are not guarantees of future performance and involve risks, uncertainties and assumptions that are difficult to predict. Therefore, actual outcomes and results may, and in some cases are likely to, differ materially from what is expressed or forecasted in the forward-looking statements due to numerous factors discussed from time to time in documents which we file with the U.S. Securities and Exchange Commission (the “SEC”), including in particular, the risks of our cryptocurrency strategy as detailed in our reports filed with the SEC. Any forward-looking statements speak only as of the date on which they are made, and except as may be required under applicable securities laws, Hyperion DeFi does not undertake any obligation to update any forward-looking statements. Disclaimer Certain information contained in this presentation and statements made orally during the corresponding earnings call relate to or are based on studies, publications, surveys and other data obtained from third-party sources and Hyperion DeFi’s own internal estimates and research. While Hyperion DeFi believes these third-party studies, publications, surveys and other data to be reliable as of the date of this presentation, it has not independently verified, and makes no representation as to the adequacy, fairness, accuracy or completeness of, any information obtained from third-party sources. In addition, no independent source has evaluated the reasonableness or accuracy of Hyperion DeFi’s internal estimates or research and no reliance should be made on any information or statements made in this presentation relating to or based on such internal estimates and research. You should conduct your own investigation and analysis of Hyperion DeFi, its business, prospects, results of operations and financial condition. In furnishing this information, Hyperion DeFi does not undertake any obligation to provide you with access to any additional information (including forward-looking information and any projections contained herein) or to update or correct the information. All figures in this presentation are not audited. Throughout this document, totals may not sum due to rounding. Calculations are based on unrounded results. Figures in $ Q3 2025 Q4 2025 Q1 2026 Gross Profit 302,506 192,897 244,271 Adjusted Gross Profit(1) 439,386 820,997 959,568 HYPE Digital Assets 37,954,590 16,233,941 25,286,164 Gross HYPE Holdings(4) 77,751,604 47,837,901 71,037,344 Net Asset Value(9) 74,545,583 44,154,737 69,873,504 Selling, General and Administrative Expense 2,594,130 4,530,542 4,493,604 Operating Expenses Excluding Stock-Based Compensation(5) 4,315,016 3,007,135 2,975,883 Net Operating (Income) Expenses (4,125,685) 39,958,264 (8,487,848) Treasury Gains (Losses) (6) 11,868,872 (36,783,228) 21,451,862 Total Other Income (Expense), Net 2,197,391 (288) 108,431 Adjusted Other Income (Expense)(7) (42,240) 48,717 52,585 Net Income (Loss) 6,625,582 (39,765,565) 8,840,550 Adjusted EBITDA(8) 7,951,003 (38,920,649) 19,488,132 |
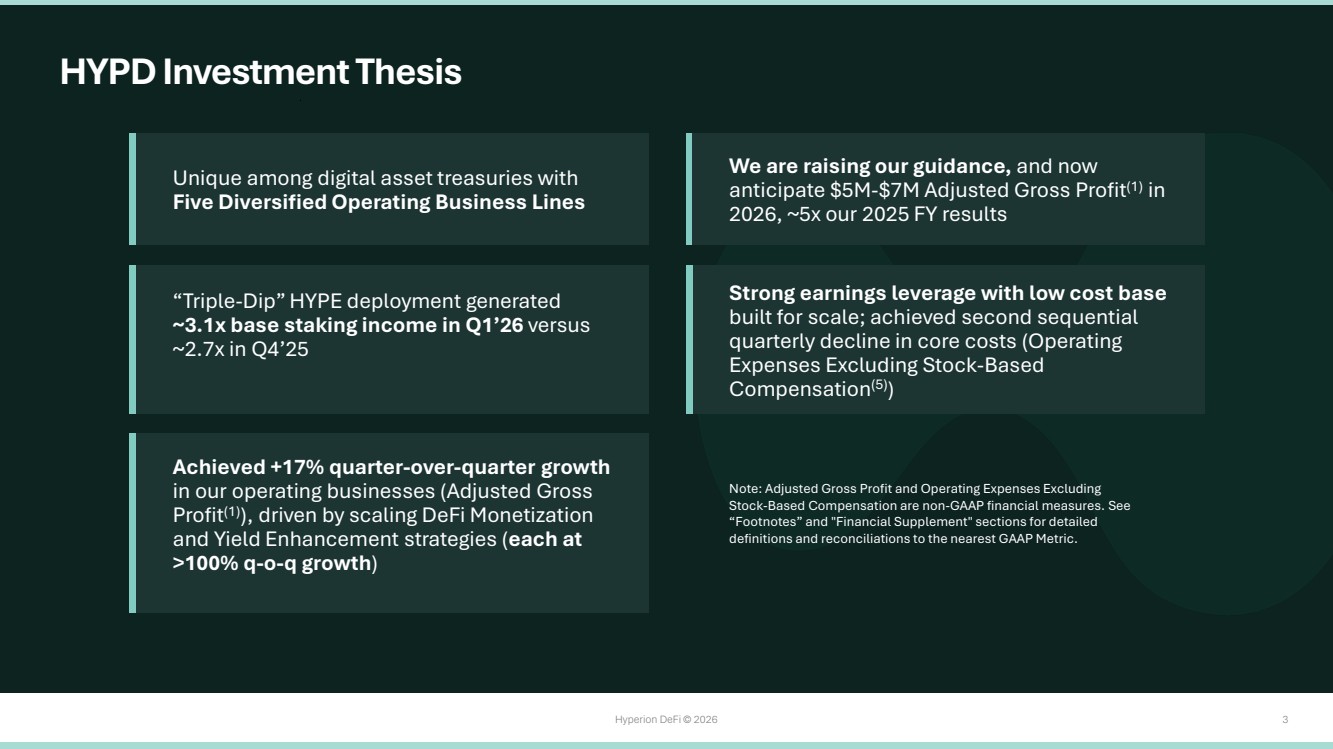
| Hyperion DeFi © 2026 3 Achieved +17% quarter-over-quarter growth in our operating businesses (Adjusted Gross Profit(1)), driven by scaling DeFi Monetization and Yield Enhancement strategies (each at >100% q-o-q growth) HYPD Investment Thesis Note: Adjusted Gross Profit and Operating Expenses Excluding Stock-Based Compensation are non-GAAP financial measures. See “Footnotes” and "Financial Supplement" sections for detailed definitions and reconciliations to the nearest GAAP Metric. “Triple-Dip” HYPE deployment generated ~3.1x base staking income in Q1’26 versus ~2.7x in Q4’25 Strong earnings leverage with low cost base built for scale; achieved second sequential quarterly decline in core costs (Operating Expenses Excluding Stock-Based Compensation(5)) We are raising our guidance, and now anticipate $5M-$7M Adjusted Gross Profit(1) in 2026, ~5x our 2025 FY results Unique among digital asset treasuries with Five Diversified Operating Business Lines |
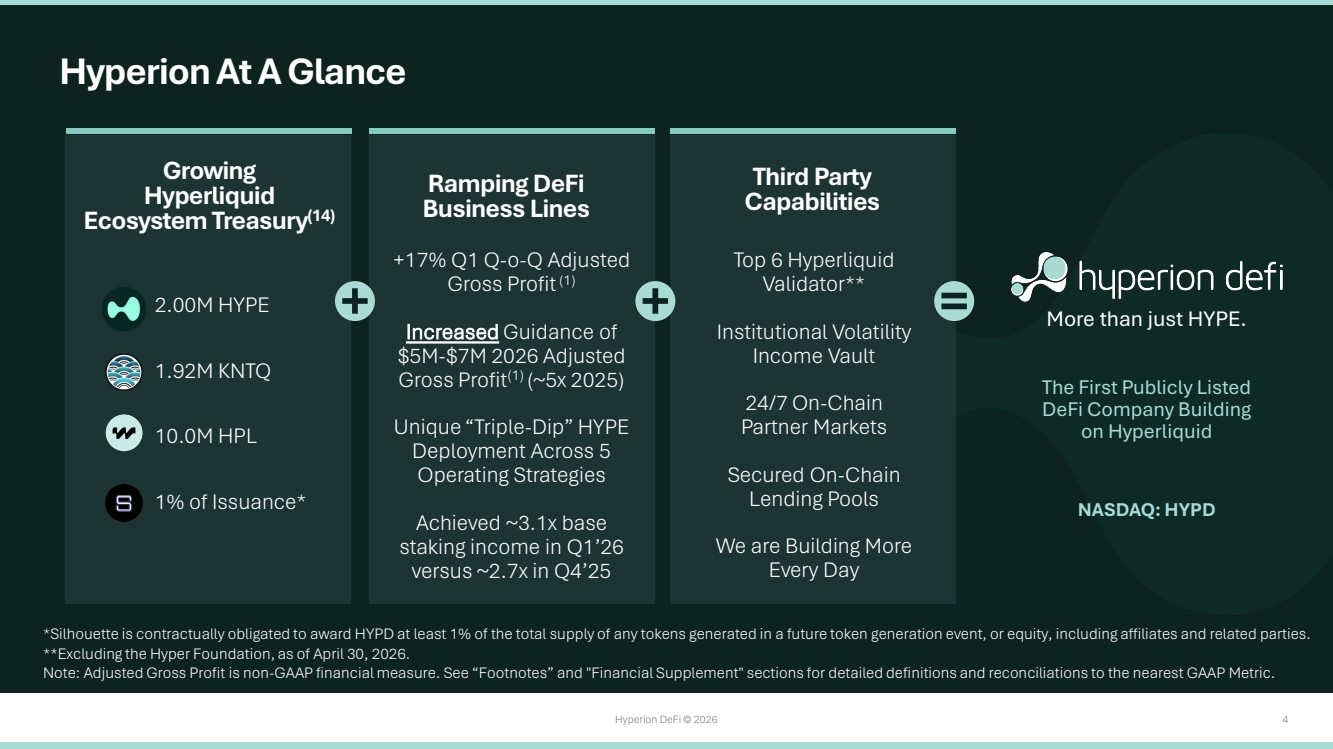
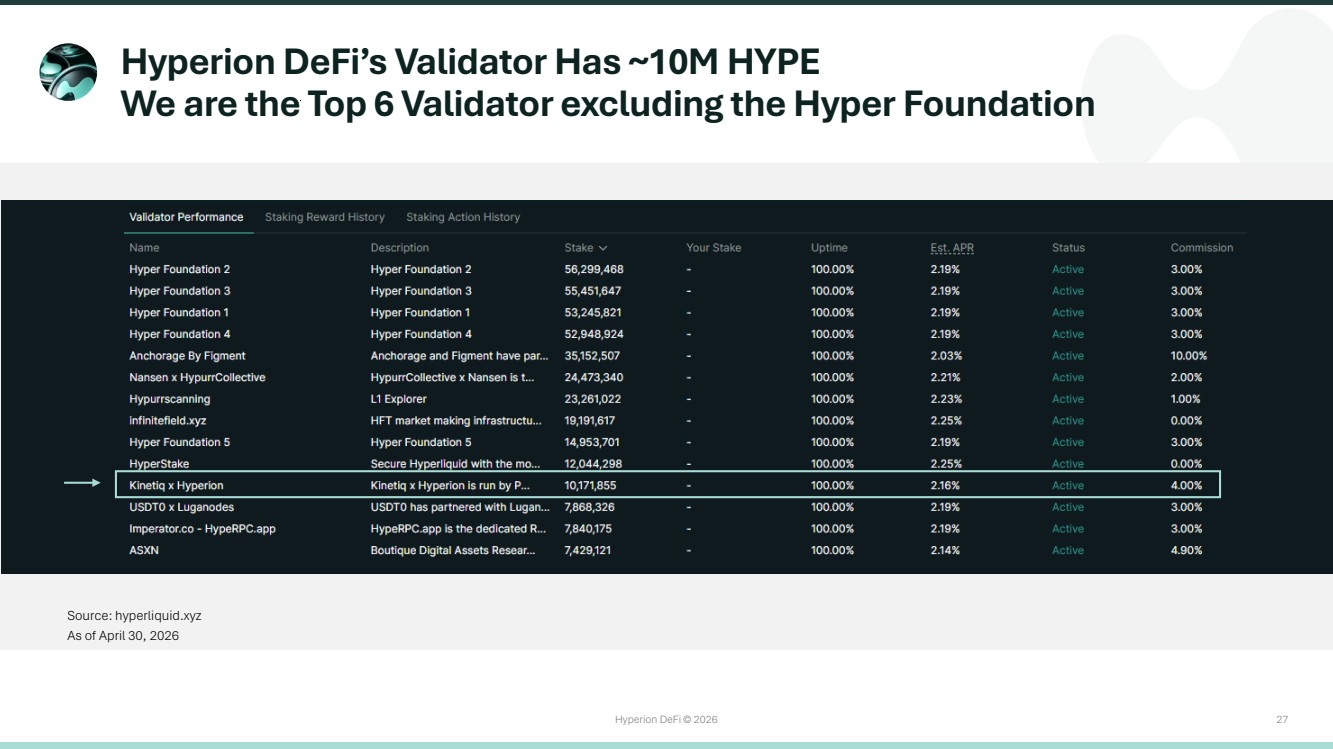
| Hyperion DeFi © 2026 4 Top 6 Hyperliquid Validator** Institutional Volatility Income Vault 24/7 On-Chain Partner Markets Secured On-Chain Lending Pools We are Building More Every Day Growing Hyperliquid Ecosystem Treasury(14) Ramping DeFi Business Lines Third Party Capabilities + + = Hyperion At A Glance +17% Q1 Q-o-Q Adjusted Gross Profit(1) Increased Guidance of $5M-$7M 2026 Adjusted Gross Profit(1) (~5x 2025) Unique “Triple-Dip” HYPE Deployment Across 5 Operating Strategies Achieved ~3.1x base staking income in Q1’26 versus ~2.7x in Q4’25 2.00M HYPE 1.92M KNTQ 10.0M HPL 1% of Issuance* The First Publicly Listed DeFi Company Building on Hyperliquid NASDAQ: HYPD More than just HYPE. *Silhouette is contractually obligated to award HYPD at least 1% of the total supply of any tokens generated in a future token generation event, or equity, including affiliates and related parties. **Excluding the Hyper Foundation, as of April 30, 2026. Note: Adjusted Gross Profit is non-GAAP financial measure. See “Footnotes” and "Financial Supplement" sections for detailed definitions and reconciliations to the nearest GAAP Metric. |
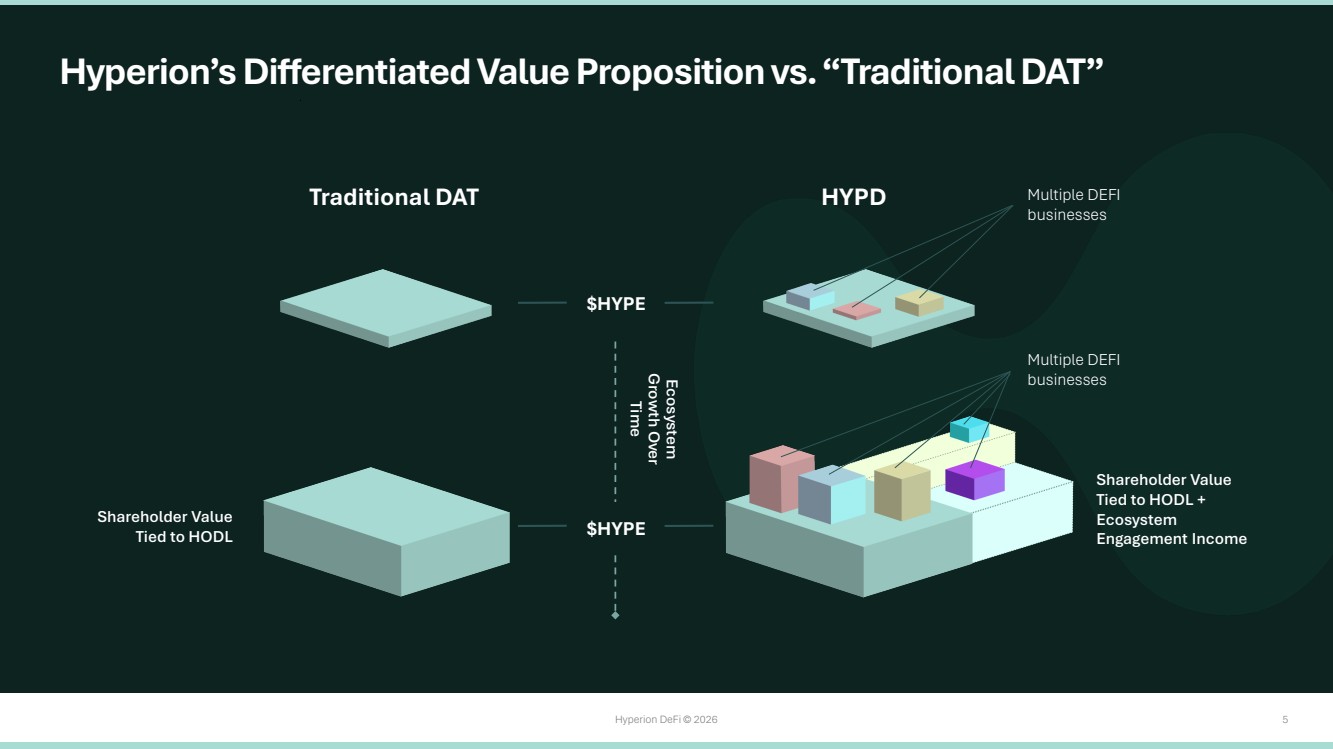
| Hyperion DeFi © 2026 5 Hyperion’s Differentiated Value Proposition vs. “Traditional DAT” $HYPE $HYPE Shareholder Value Tied to HODL + Ecosystem Engagement Income Shareholder Value Tied to HODL Multiple DEFI businesses Multiple DEFI businesses Traditional DAT HYPD Growth Over Ecosystem Time |
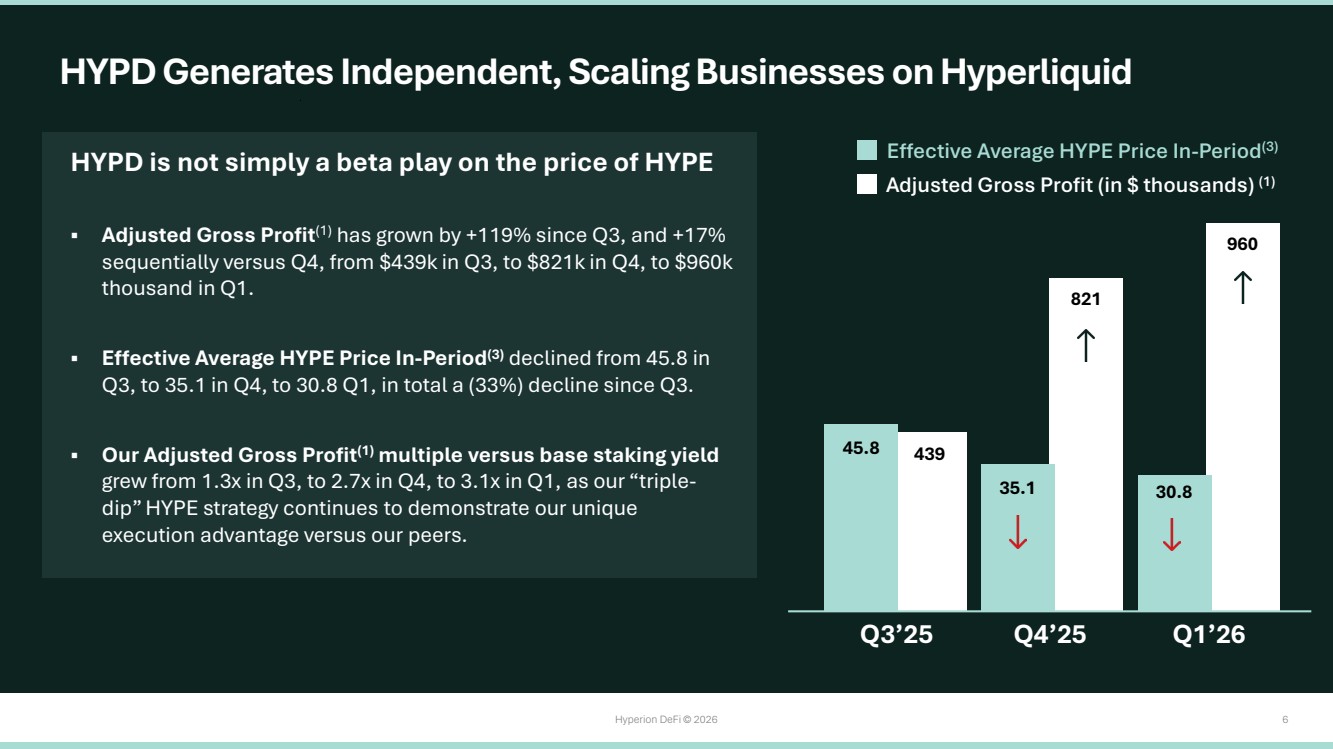
| Hyperion DeFi © 2026 6 HYPD is not simply a beta play on the price of HYPE Adjusted Gross Profit(1) has grown by +119% since Q3, and +17% sequentially versus Q4, from $439k in Q3, to $821k in Q4, to $960k thousand in Q1. Effective Average HYPE Price In-Period(3) declined from 45.8 in Q3, to 35.1 in Q4, to 30.8 Q1, in total a (33%) decline since Q3. Our Adjusted Gross Profit(1) multiple versus base staking yield grew from 1.3x in Q3, to 2.7x in Q4, to 3.1x in Q1, as our “triple-dip” HYPE strategy continues to demonstrate our unique execution advantage versus our peers. Effective Average HYPE Price In-Period(3) Adjusted Gross Profit (in $ thousands) (1) 45.8 439 35.1 821 30.8 960 HYPD Generates Independent, Scaling Businesses on Hyperliquid Q3’25 Q4’25 Q1’26 |
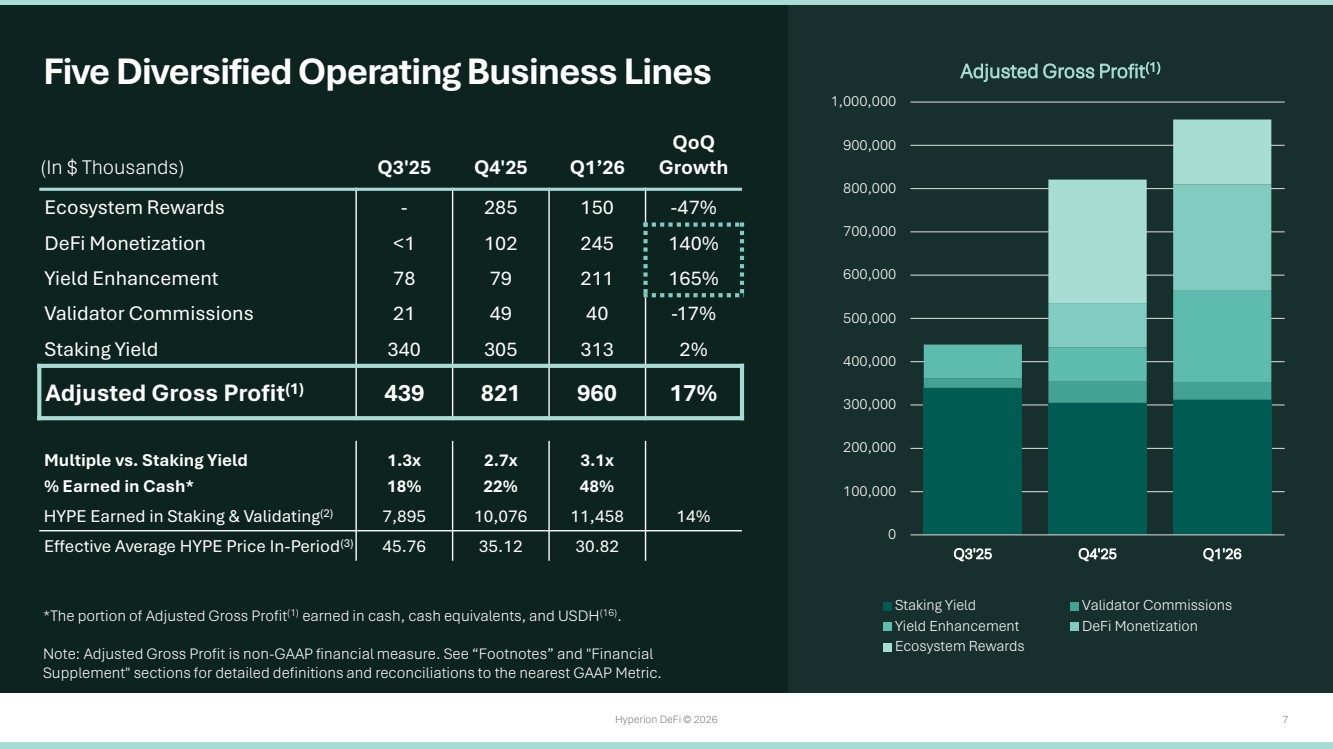
| Hyperion DeFi © 2026 7 Five Diversified Operating Business Lines (In $ Thousands) Q3'25 Q4'25 Q1’26 QoQ Growth Ecosystem Rewards - 285 150 -47% DeFi Monetization <1 102 245 140% Yield Enhancement 78 79 211 165% Validator Commissions 21 49 40 -17% Staking Yield 340 305 313 2% Adjusted Gross Profit(1) 439 821 960 17% Multiple vs. Staking Yield 1.3x 2.7x 3.1x % Earned in Cash* 18% 22% 48% HYPE Earned in Staking & Validating(2) 7,895 10,076 11,458 14% Effective Average HYPE Price In-Period(3) 45.76 35.12 30.82 *The portion of Adjusted Gross Profit(1) earned in cash, cash equivalents, and USDH(16). Note: Adjusted Gross Profit is non-GAAP financial measure. See “Footnotes” and "Financial Supplement" sections for detailed definitions and reconciliations to the nearest GAAP Metric. 0 100,000 200,000 300,000 400,000 500,000 600,000 700,000 800,000 900,000 1,000,000 Q3'25 Q4'25 Q1'26 Adjusted Gross Profit(1) Staking Yield Validator Commissions Yield Enhancement DeFi Monetization Ecosystem Rewards |
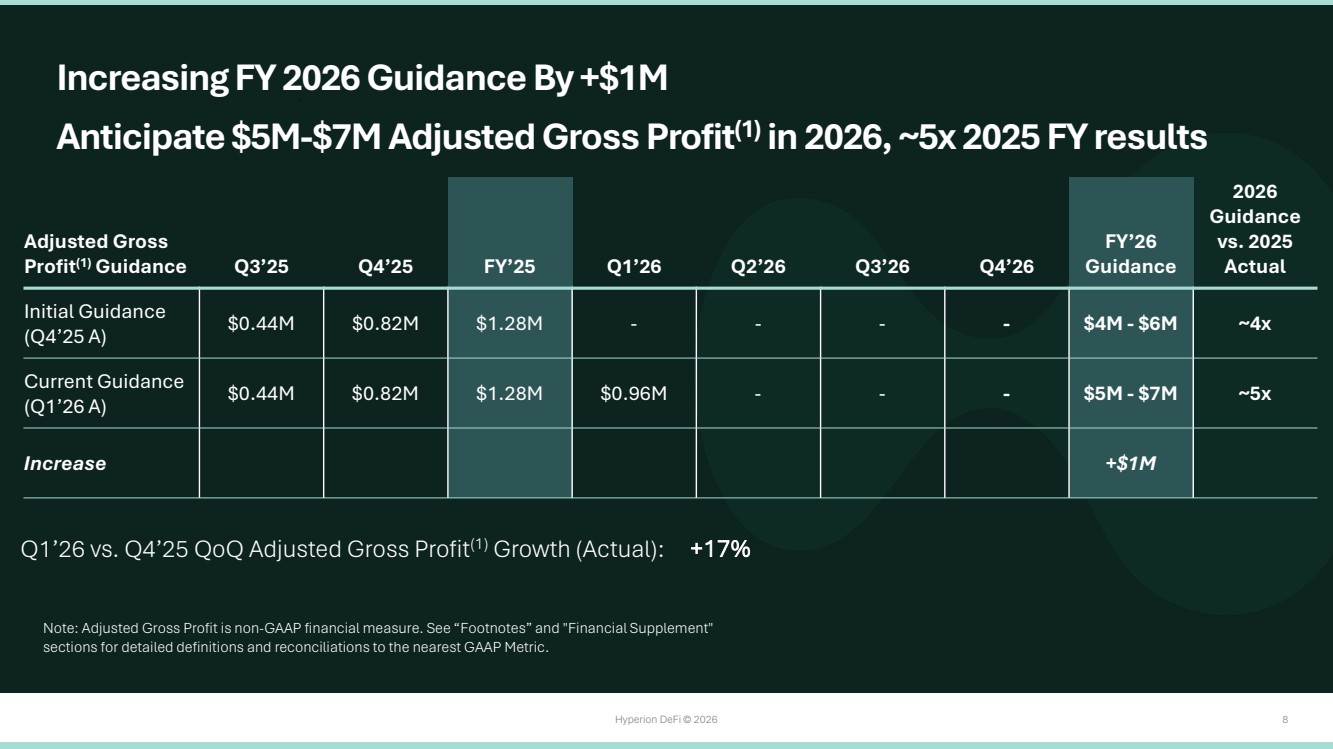
| Hyperion DeFi © 2026 8 Increasing FY 2026 Guidance By +$1M Anticipate $5M-$7M Adjusted Gross Profit(1) in 2026, ~5x 2025 FY results Adjusted Gross Profit(1) Guidance Q3’25 Q4’25 FY’25 Q1’26 Q2’26 Q3’26 Q4’26 FY’26 Guidance 2026 Guidance vs. 2025 Actual Initial Guidance (Q4’25 A) $0.44M $0.82M $1.28M - - - - $4M - $6M ~4x Current Guidance (Q1’26 A) $0.44M $0.82M $1.28M $0.96M - - - $5M - $7M ~5x Increase +$1M Q1’26 vs. Q4’25 QoQ Adjusted Gross Profit(1) Growth (Actual): +17% Note: Adjusted Gross Profit is non-GAAP financial measure. See “Footnotes” and "Financial Supplement" sections for detailed definitions and reconciliations to the nearest GAAP Metric. |
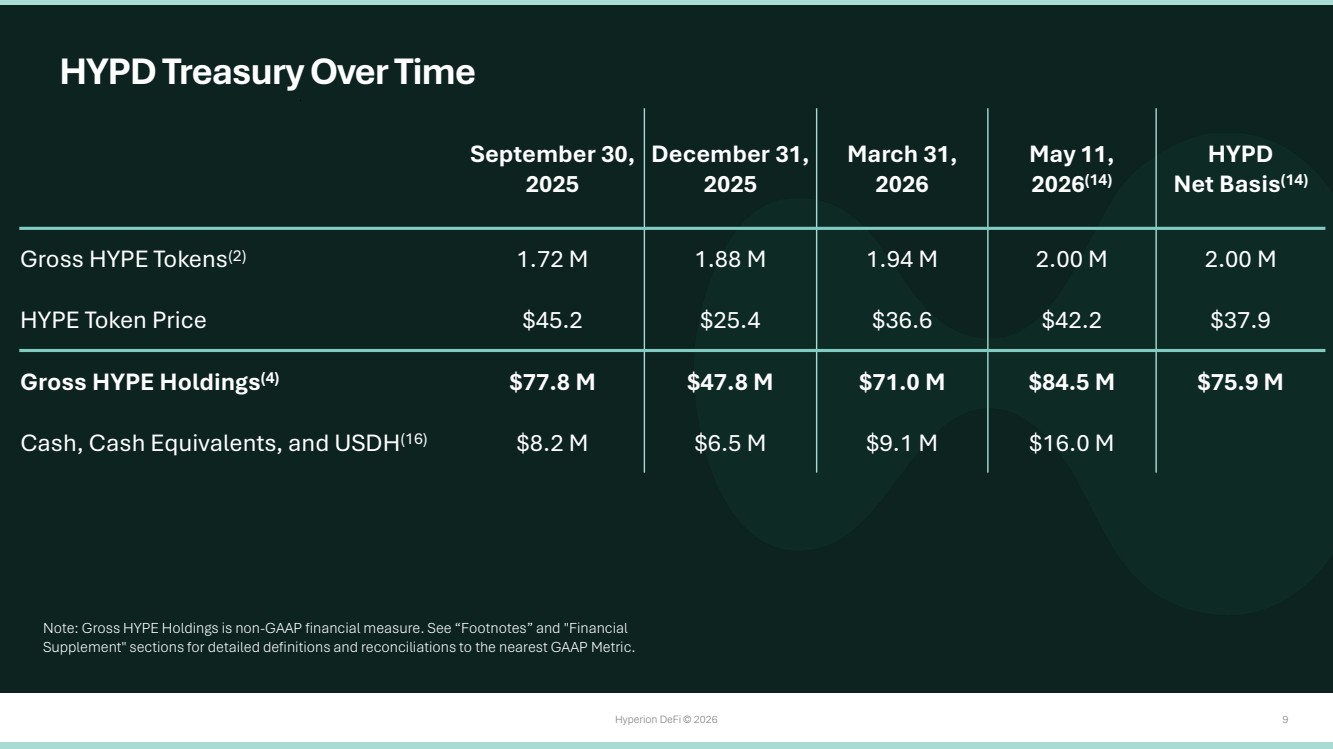
| Hyperion DeFi © 2026 9 HYPD Treasury Over Time Note: Gross HYPE Holdings is non-GAAP financial measure. See “Footnotes” and "Financial Supplement" sections for detailed definitions and reconciliations to the nearest GAAP Metric. September 30, 2025 December 31, 2025 March 31, 2026 May 11, 2026(14) HYPD Net Basis(14) Gross HYPE Tokens(2) 1.72 M 1.88 M 1.94 M 2.00 M 2.00 M HYPE Token Price $45.2 $25.4 $36.6 $42.2 $37.9 Gross HYPE Holdings(4) $77.8 M $47.8 M $71.0 M $84.5 M $75.9 M Cash, Cash Equivalents, and USDH(16) $8.2 M $6.5 M $9.1 M $16.0 M |
| Hyperion DeFi © 2026 10 Our DeFi Partners Note: All metrics in this “Our DeFi Partners” Section are as of April 30, 2026, unless otherwise indicated |

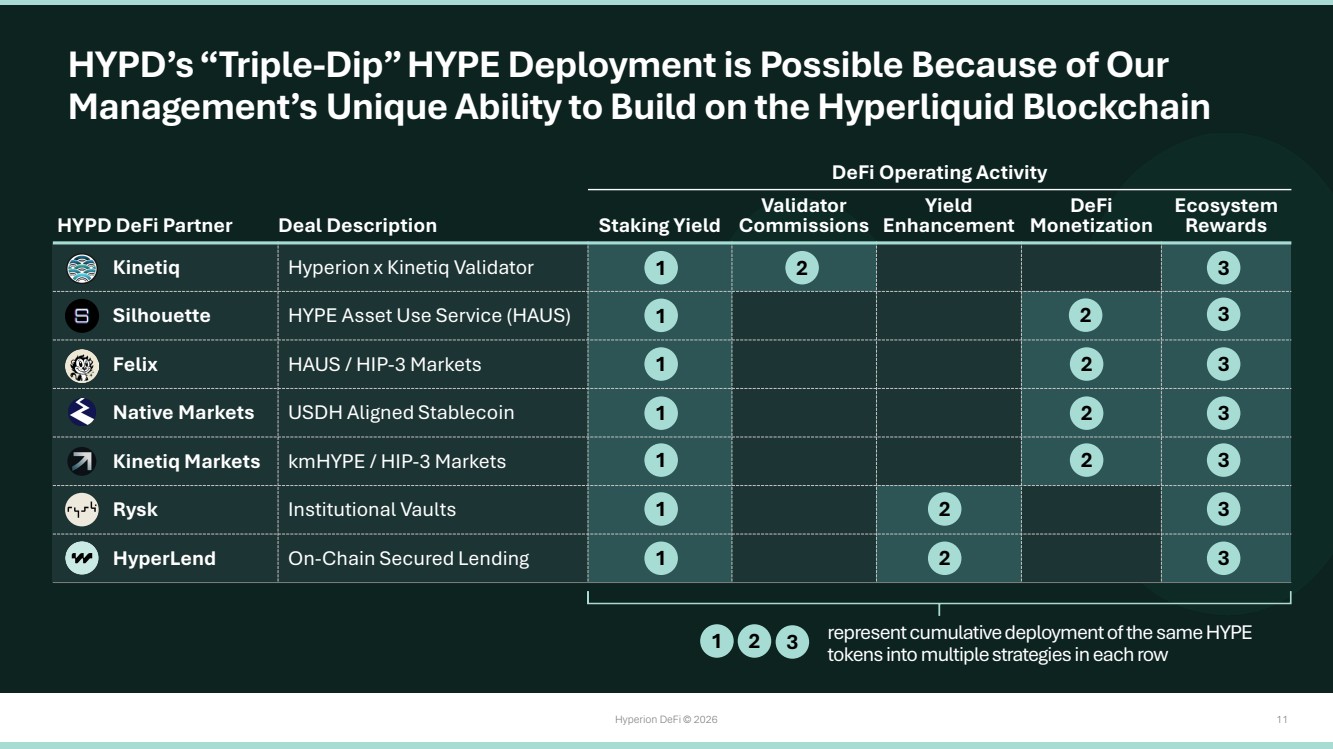
| Hyperion DeFi © 2026 11 HYPD’s “Triple-Dip” HYPE Deployment is Possible Because of Our Management’s Unique Ability to Build on the Hyperliquid Blockchain HYPD DeFi Partner Deal Description DeFi Operating Activity Staking Yield Validator Commissions Yield Enhancement DeFi Monetization Ecosystem Rewards Kinetiq Hyperion x Kinetiq Validator Silhouette HYPE Asset Use Service (HAUS) Felix HAUS / HIP-3 Markets Native Markets USDH Aligned Stablecoin Kinetiq Markets kmHYPE / HIP-3 Markets Rysk Institutional Vaults HyperLend On-Chain Secured Lending 1 1 1 1 1 1 1 3 3 3 3 3 3 3 2 2 2 2 2 2 2 represent cumulative deployment of the same HYPE tokens into multiple strategies in each row 1 2 3 |
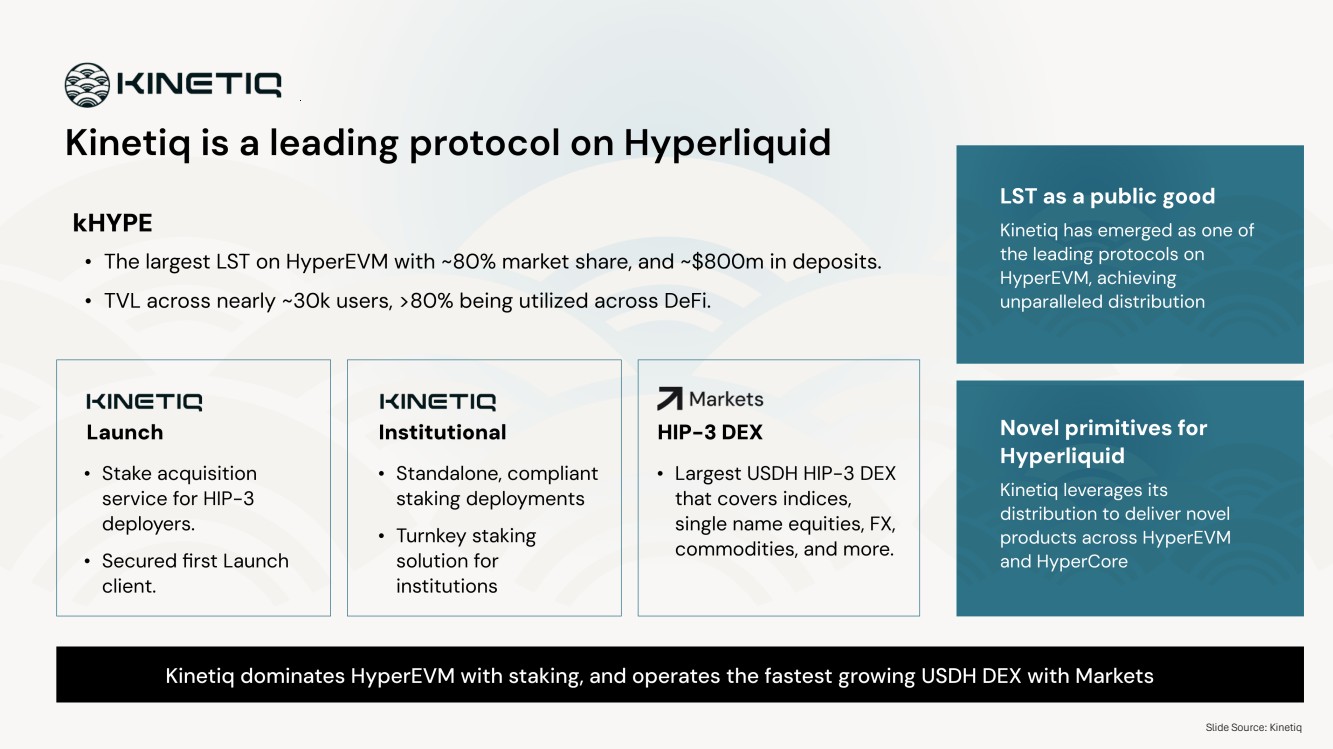
| Hyperion DeFi © 2026 12 Slide Source: Kinetiq |
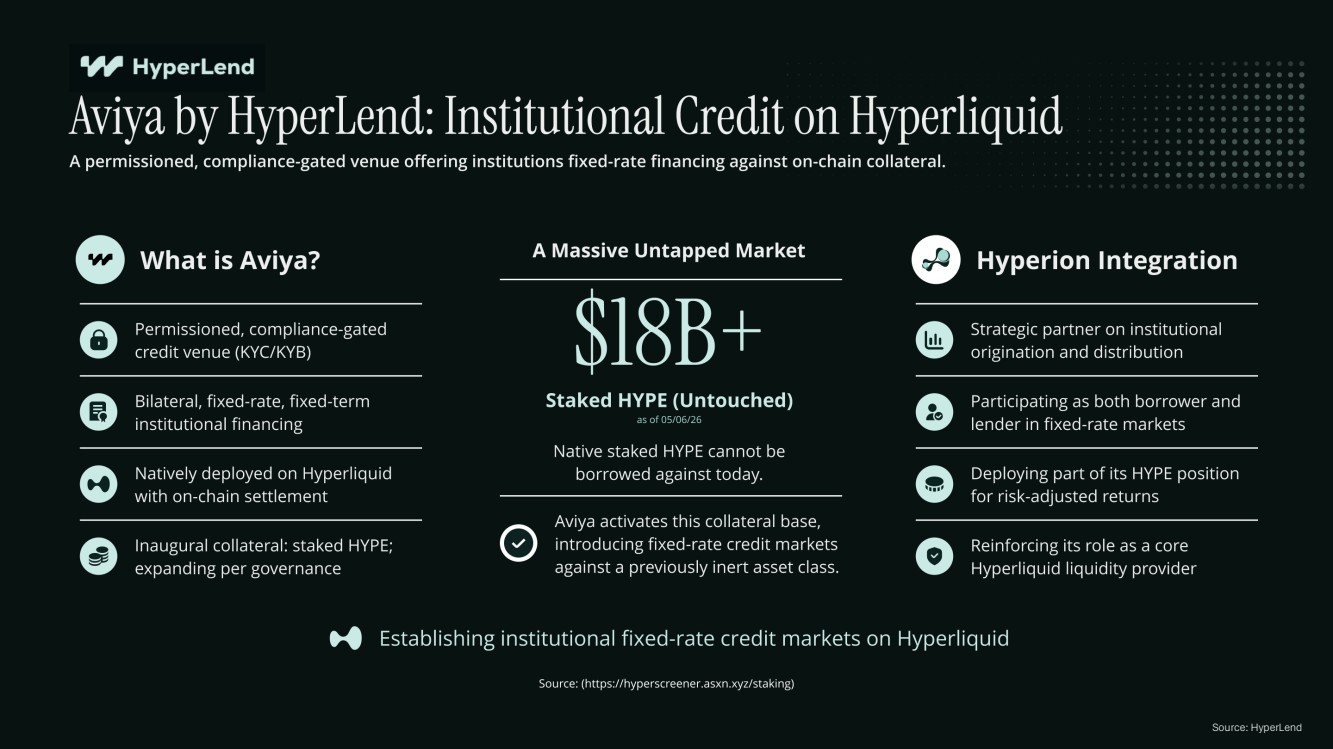
| Hyperion DeFi © 2026 13 Source: HyperLend |
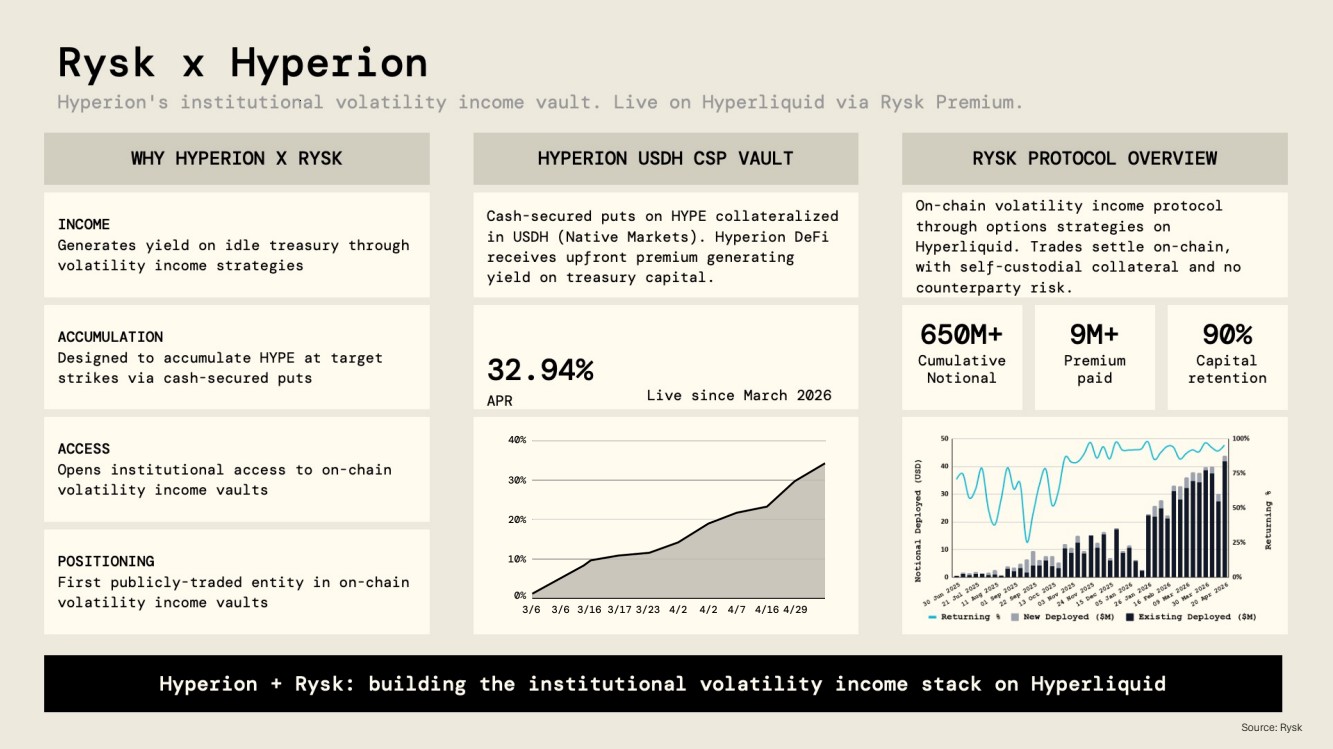
| Hyperion DeFi © 2026 14 Source: Rysk |
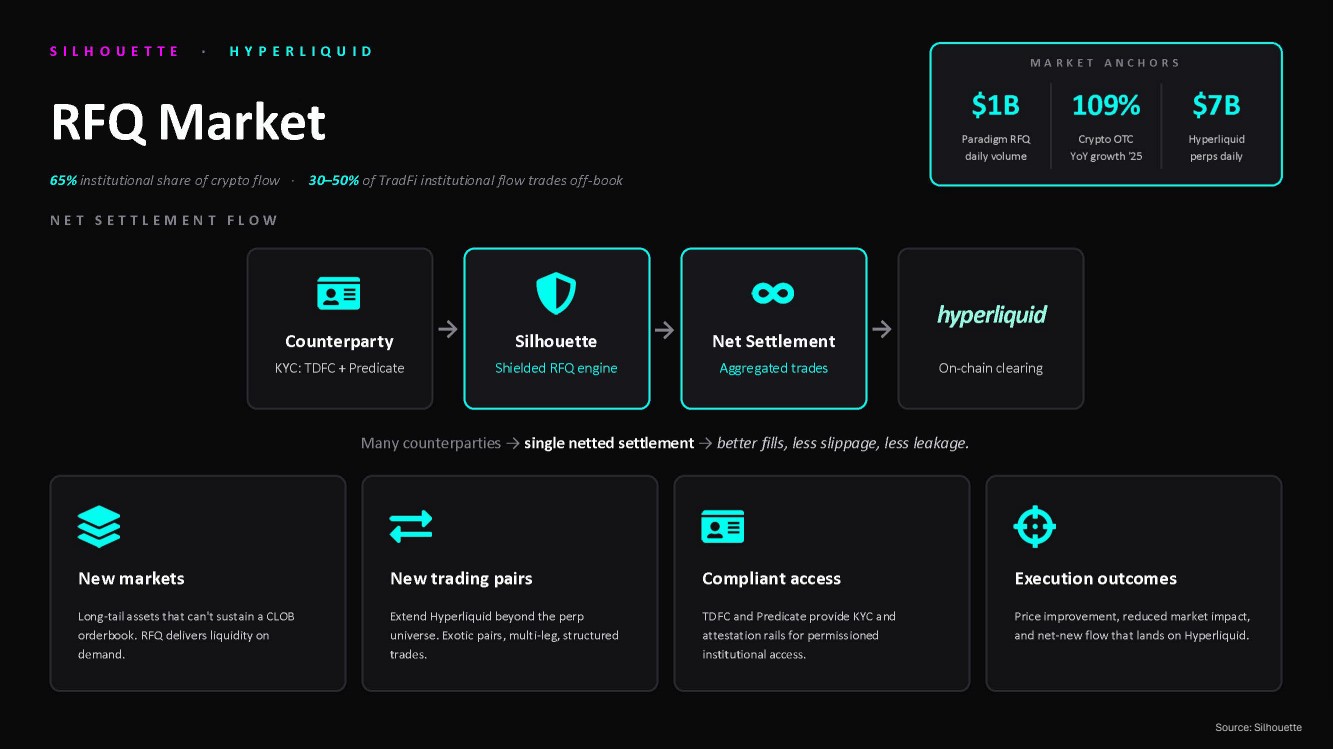
| Hyperion DeFi © 2026 15 Source: Silhouette |
| Hyperion DeFi © 2026 16 About Hyperliquid Note: All metrics in this “About Hyperliquid” Section are as of April 30, 2026, unless otherwise indicated |
| Hyperion DeFi © 2026 17 Hyperliquid In The News |

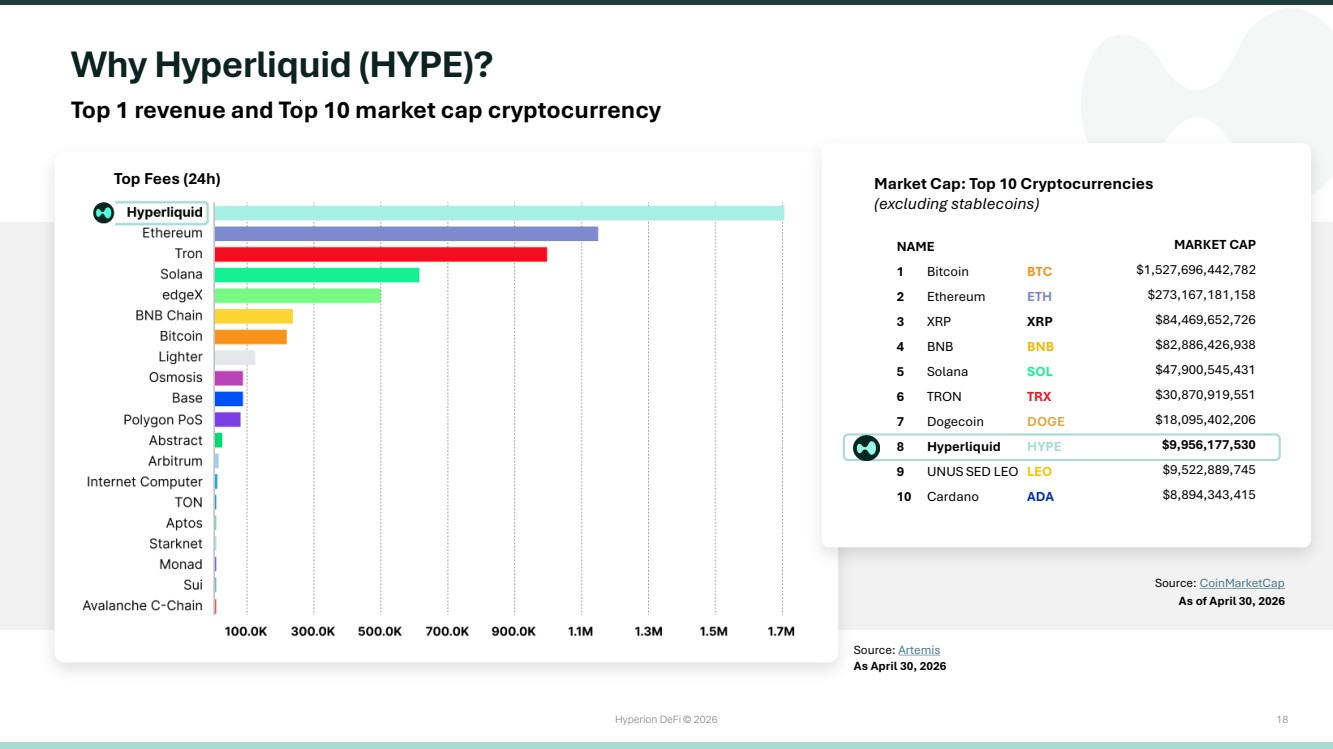
| Hyperion DeFi © 2026 18 [ Why Hyperliquid (HYPE)? Top 1 revenue and Top 10 market cap cryptocurrency Source: CoinMarketCap Source: Artemis As April 30, 2026 As of April 30, 2026 Top Fees (24h) [ NAME 1 Bitcoin BTC 2 Ethereum ETH 3 XRP XRP 4 BNB BNB 5 Solana SOL 6 TRON TRX 7 Dogecoin DOGE 8 Hyperliquid HYPE 9 UNUS SED LEO LEO 10 Cardano ADA Market Cap: Top 10 Cryptocurrencies (excluding stablecoins) MARKET CAP $1,527,696,442,782 $273,167,181,158 $84,469,652,726 $82,886,426,938 $47,900,545,431 $30,870,919,551 $18,095,402,206 $9,956,177,530 $9,522,889,745 $8,894,343,415 |
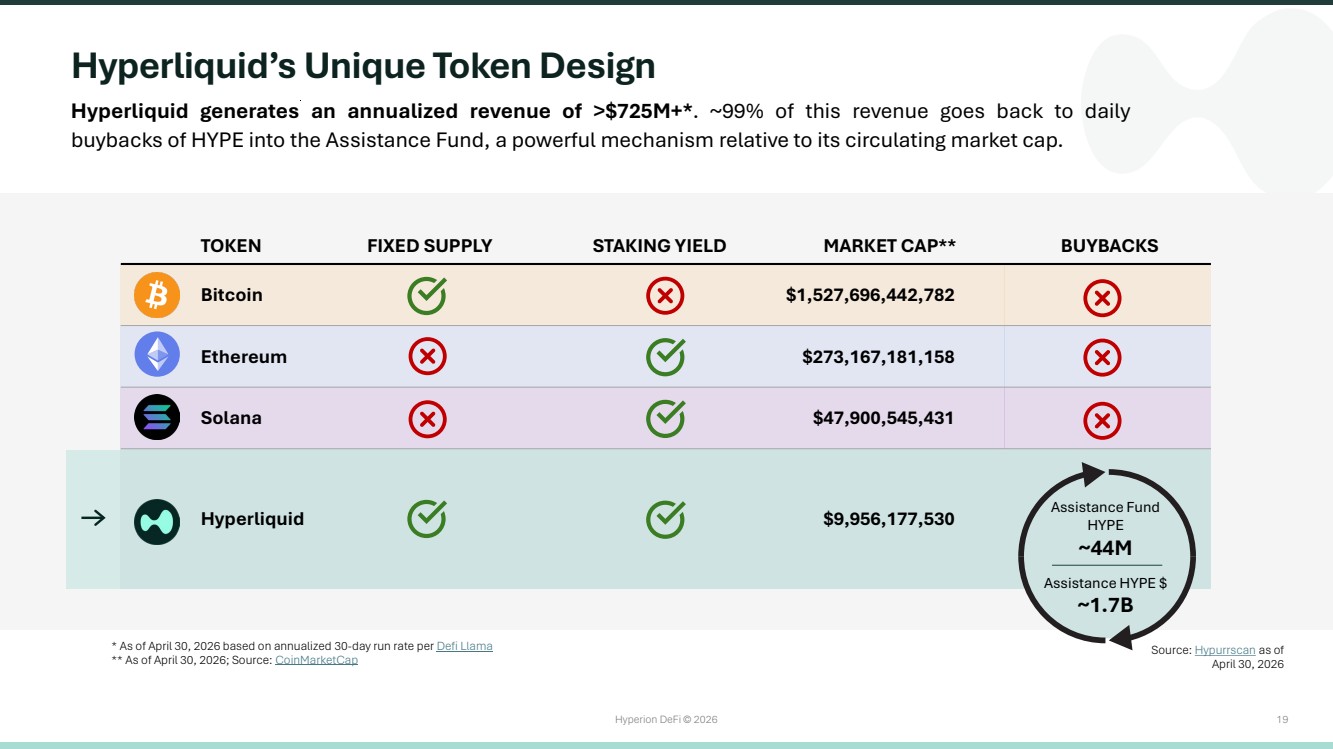
| Hyperion DeFi © 2026 19 TOKEN FIXED SUPPLY STAKING YIELD MARKET CAP** BUYBACKS Bitcoin $1,527,696,442,782 Ethereum $273,167,181,158 Solana $47,900,545,431 Hyperliquid $9,956,177,530 Hyperliquid’s Unique Token Design Hyperliquid generates an annualized revenue of >$725M+*. ~99% of this revenue goes back to daily buybacks of HYPE into the Assistance Fund, a powerful mechanism relative to its circulating market cap. Assistance Fund HYPE ~44M Assistance HYPE $ ~1.7B Source: Hypurrscan as of April 30, 2026 * As of April 30, 2026 based on annualized 30-day run rate per Defi Llama ** As of April 30, 2026; Source: CoinMarketCap |
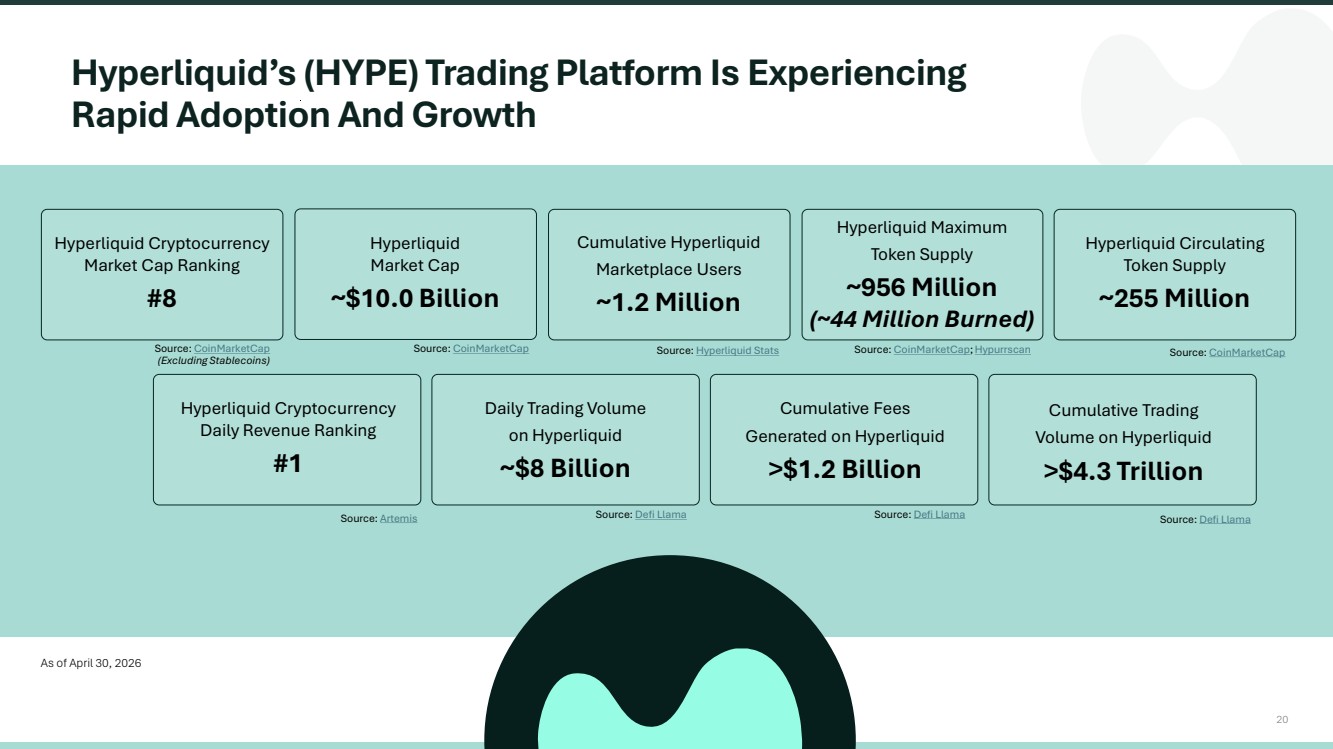
| Hyperion DeFi © 2026 20 Hyperliquid’s (HYPE) Trading Platform Is Experiencing Rapid Adoption And Growth Hyperliquid Cryptocurrency Market Cap Ranking #8 Hyperliquid Market Cap ~$10.0 Billion Cumulative Fees Generated on Hyperliquid >$1.2 Billion Hyperliquid Circulating Token Supply ~255 Million Cumulative Hyperliquid Marketplace Users ~1.2 Million Hyperliquid Maximum Token Supply ~956 Million (~44 Million Burned) Hyperliquid Cryptocurrency Daily Revenue Ranking #1 Source: Hyperliquid Stats Source: Defi Llama Source: Defi Llama Source: CoinMarketCap; Hypurrscan Source: CoinMarketCap Source: CoinMarketCap Source: CoinMarketCap (Excluding Stablecoins) Source: Artemis As of April 30, 2026 Daily Trading Volume on Hyperliquid ~$8 Billion Cumulative Trading Volume on Hyperliquid >$4.3 Trillion Source: Defi Llama |
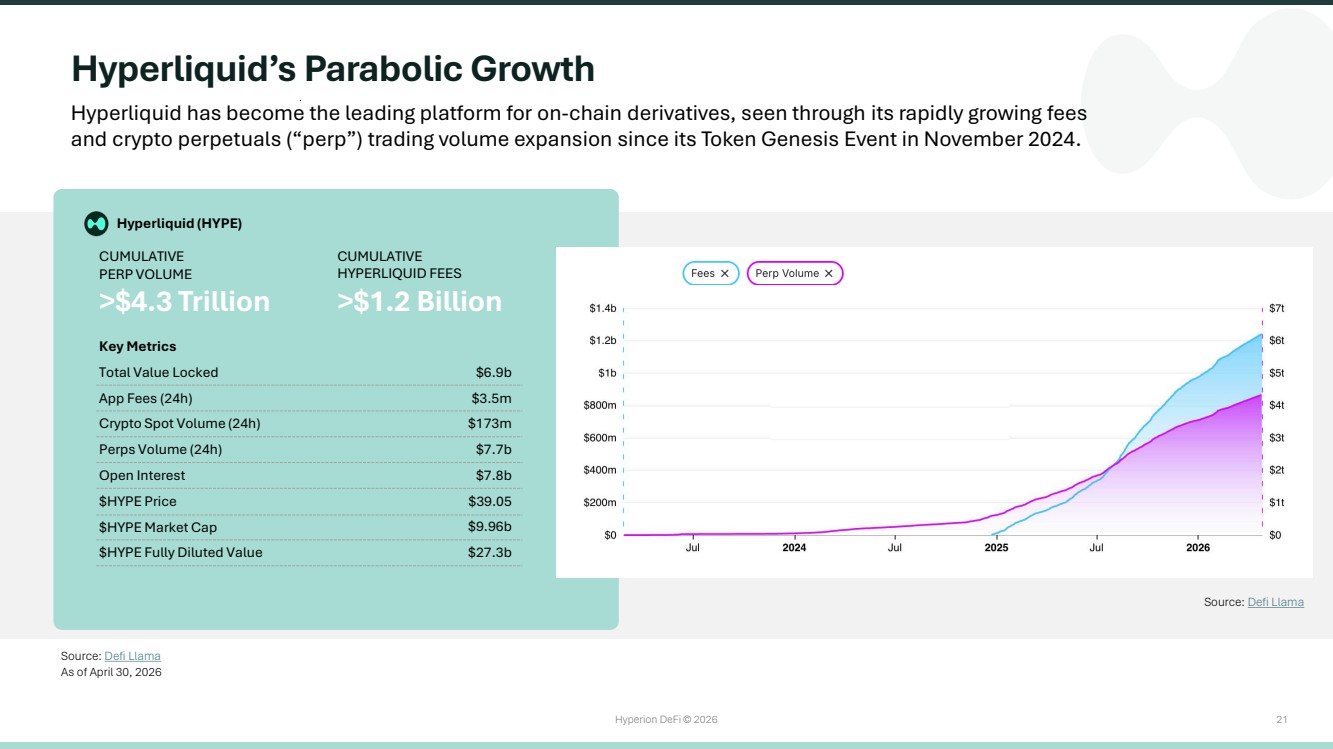
| Hyperion DeFi © 2026 21 Hyperliquid’s Parabolic Growth Hyperliquid has become the leading platform for on-chain derivatives, seen through its rapidly growing fees and crypto perpetuals (“perp”) trading volume expansion since its Token Genesis Event in November 2024. Source: Defi Llama Key Metrics Total Value Locked App Fees (24h) Crypto Spot Volume (24h) Perps Volume (24h) Open Interest $HYPE Price $HYPE Market Cap $HYPE Fully Diluted Value $6.9b $3.5m $173m $7.7b $7.8b $39.05 $9.96b $27.3b >$4.3 Trillion CUMULATIVE PERP VOLUME Hyperliquid (HYPE) As of April 30, 2026 >$1.2 Billion CUMULATIVE HYPERLIQUID FEES Source: Defi Llama |
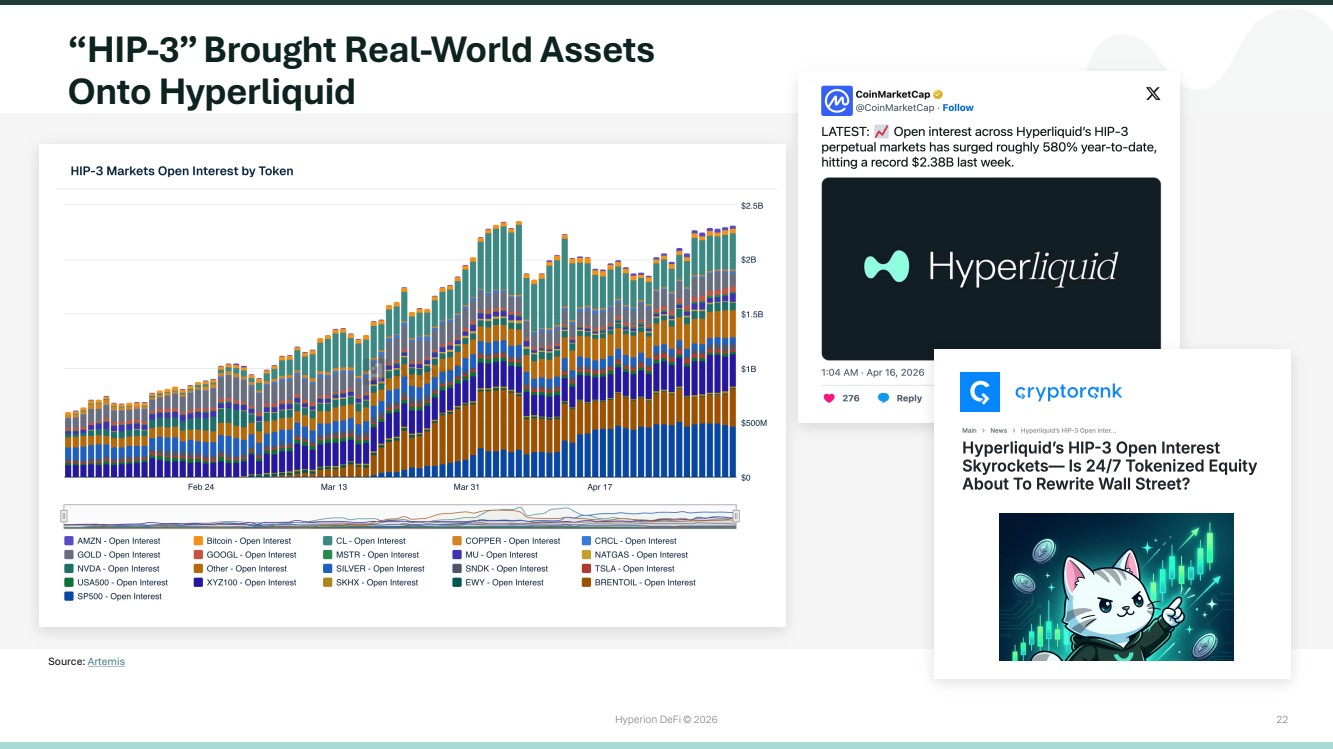
| Hyperion DeFi © 2026 22 “HIP-3” Brought Real-World Assets Onto Hyperliquid Source: Artemis |
| Hyperion DeFi © 2026 23 About Hyperion DeFi Note: All metrics in this “About Hyperion DeFi” Section are as of April 30, 2026, unless otherwise indicated |
| Hyperion DeFi © 2026 24 Hyperion DeFi Is an Ecosystem Builder and Hyperliquid Advocate |

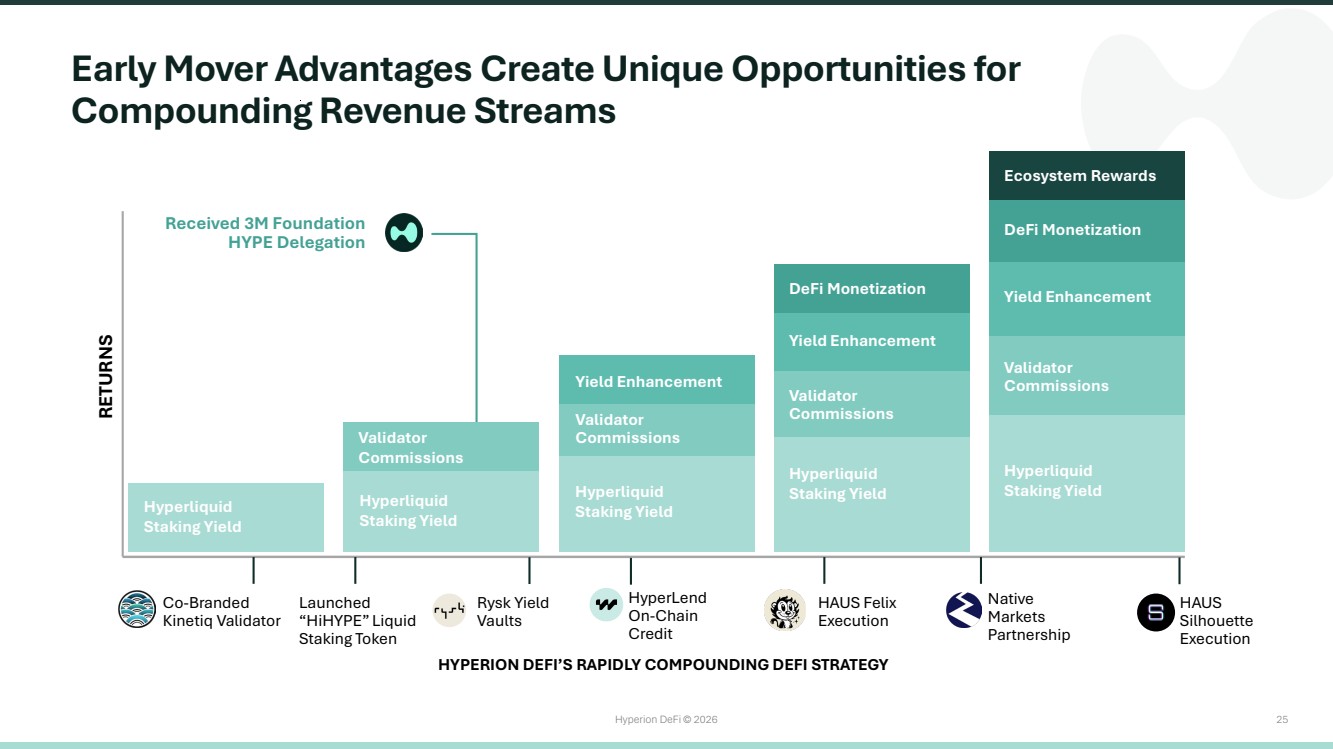
| Hyperion DeFi © 2026 25 Early Mover Advantages Create Unique Opportunities for Compounding Revenue Streams Hyperliquid Staking Yield Validator Commissions Hyperliquid Staking Yield Hyperliquid Staking Yield Validator Commissions Yield Enhancement Validator Commissions Yield Enhancement Hyperliquid Staking Yield DeFi Monetization Validator Commissions Yield Enhancement Hyperliquid Staking Yield DeFi Monetization Ecosystem Rewards RETURNS HYPERION DEFI’S RAPIDLY COMPOUNDING DEFI STRATEGY Received 3M Foundation HYPE Delegation HAUS Felix Execution Co-Branded Kinetiq Validator Launched “HiHYPE” Liquid Staking Token Native Markets Partnership Rysk Yield Vaults HyperLend On-Chain Credit HAUS Silhouette Execution |
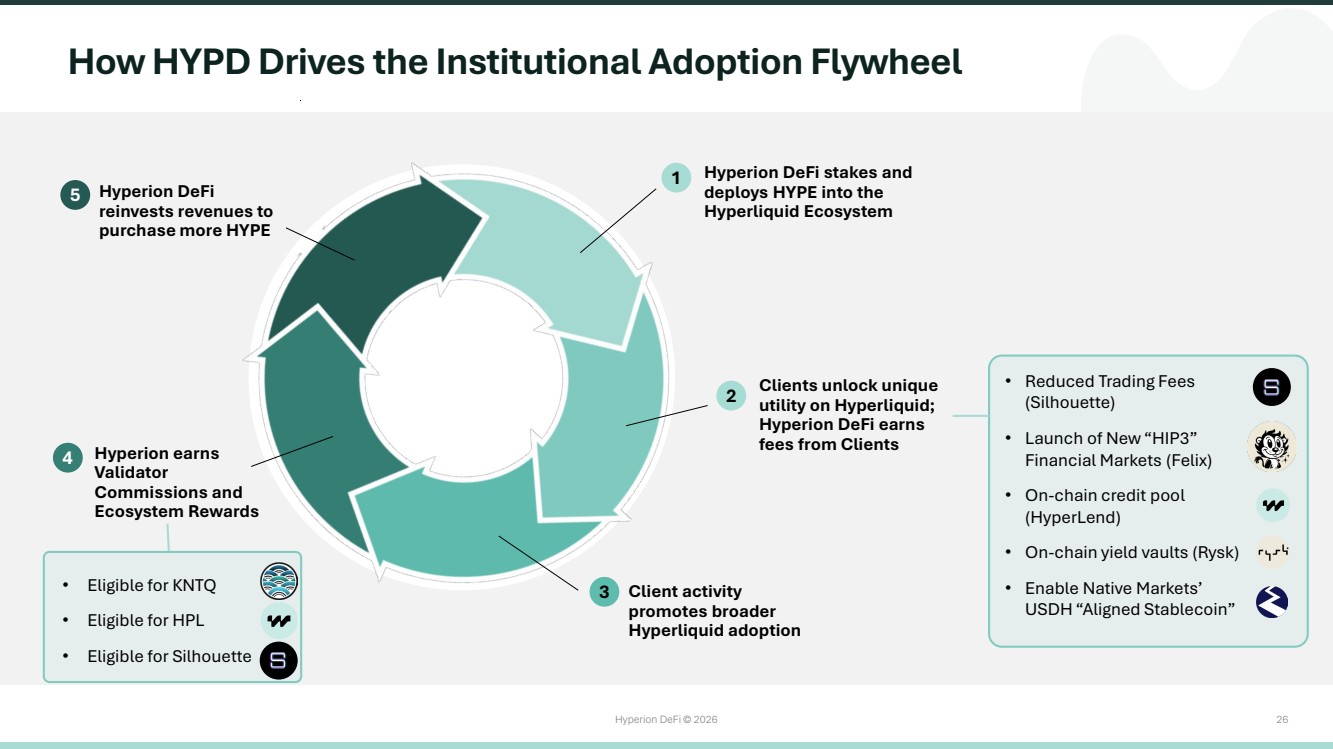
| Hyperion DeFi © 2026 26 Hyperion DeFi stakes and deploys HYPE into the Hyperliquid Ecosystem Clients unlock unique utility on Hyperliquid; Hyperion DeFi earns fees from Clients Client activity promotes broader Hyperliquid adoption Hyperion earns Validator Commissions and Ecosystem Rewards Hyperion DeFi reinvests revenues to purchase more HYPE How HYPD Drives the Institutional Adoption Flywheel • Reduced Trading Fees (Silhouette) • Launch of New “HIP3” Financial Markets (Felix) • On-chain credit pool (HyperLend) • On-chain yield vaults (Rysk) • Enable Native Markets’ USDH “Aligned Stablecoin” 1 2 3 4 5 • Eligible for KNTQ • Eligible for HPL • Eligible for Silhouette |
| Hyperion DeFi © 2026 27 As of January 31, 2026 Source: hyperliquid.xyz As of April 30, 2026 Hyperion DeFi’s Validator Has ~10M HYPE We are the Top 6 Validator excluding the Hyper Foundation |
| Hyperion DeFi © 2026 28 Frictionless exposure to Hyperliquid’s native token HYPE. Access next-generation Decentralized Finance (DeFi). Bridging public markets and on-chain strategies. More than just HYPE. NASDAQ: HYPD |
| Hyperion DeFi © 2026 29 Financial Supplement |
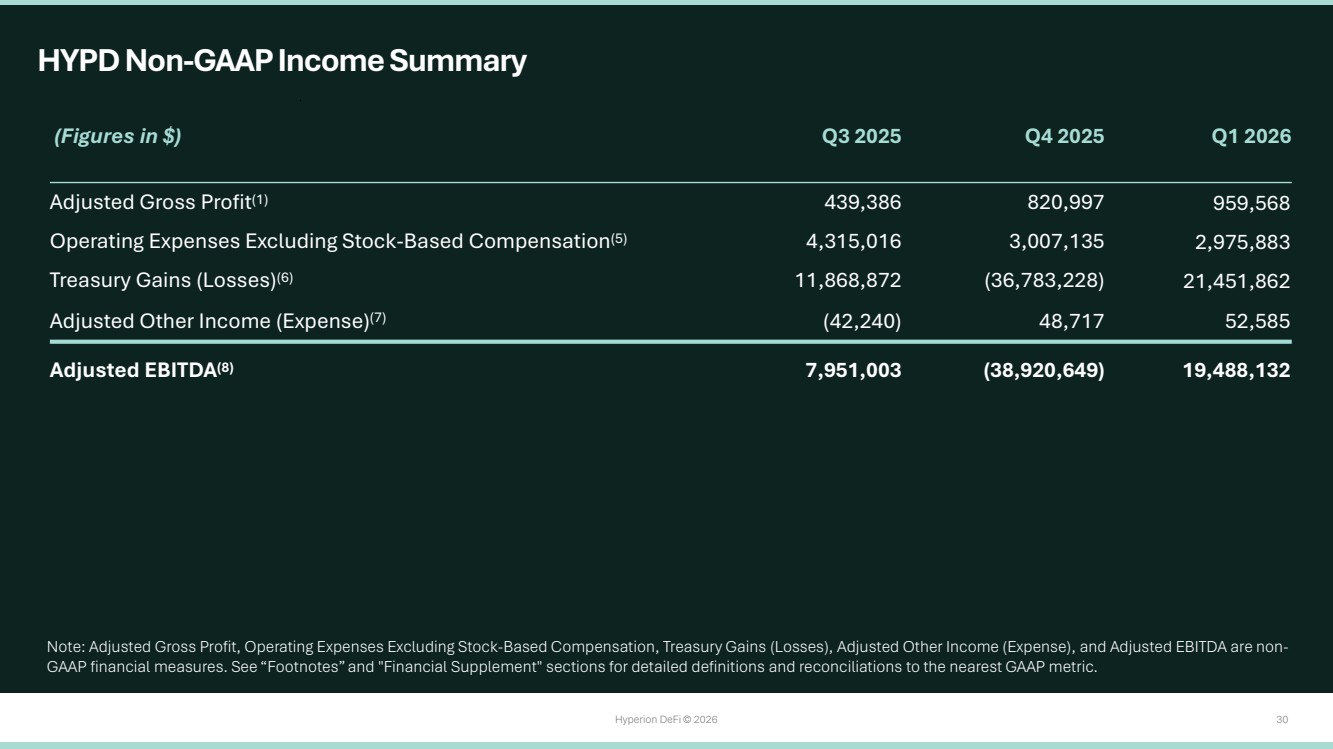
| Hyperion DeFi © 2026 30 HYPD Non-GAAP Income Summary Note: Adjusted Gross Profit, Operating Expenses Excluding Stock-Based Compensation, Treasury Gains (Losses), Adjusted Other Income (Expense), and Adjusted EBITDA are non-GAAP financial measures. See “Footnotes” and "Financial Supplement" sections for detailed definitions and reconciliations to the nearest GAAP metric. (Figures in $) Q3 2025 Q4 2025 Q1 2026 Adjusted Gross Profit(1) 439,386 820,997 959,568 Operating Expenses Excluding Stock-Based Compensation(5) 4,315,016 3,007,135 2,975,883 Treasury Gains (Losses)(6) 11,868,872 (36,783,228) 21,451,862 Adjusted Other Income (Expense)(7) (42,240) 48,717 52,585 Adjusted EBITDA(8) 7,951,003 (38,920,649) 19,488,132 |
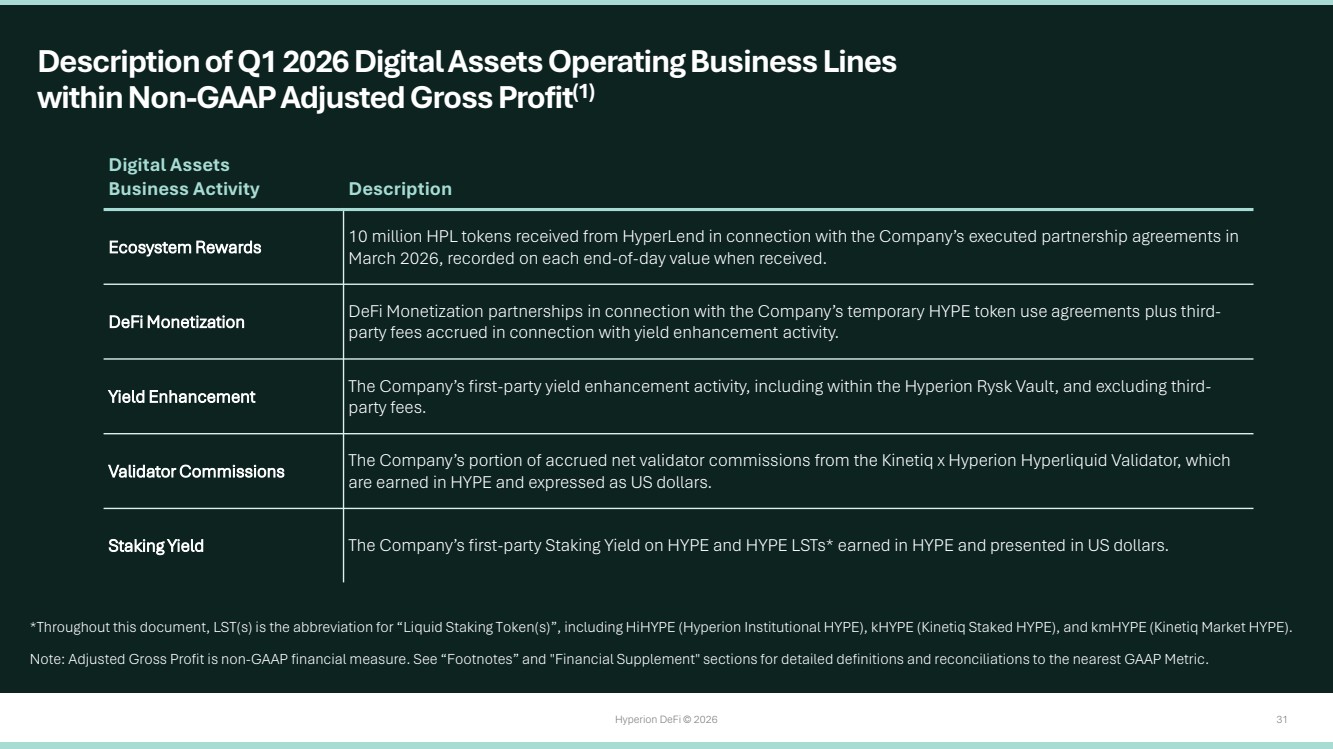
| Hyperion DeFi © 2026 31 Description of Q1 2026 Digital Assets Operating Business Lines within Non-GAAP Adjusted Gross Profit(1) *Throughout this document, LST(s) is the abbreviation for “Liquid Staking Token(s)”, including HiHYPE (Hyperion Institutional HYPE), kHYPE (Kinetiq Staked HYPE), and kmHYPE (Kinetiq Market HYPE). Note: Adjusted Gross Profit is non-GAAP financial measure. See “Footnotes” and "Financial Supplement" sections for detailed definitions and reconciliations to the nearest GAAP Metric. Digital Assets Business Activity Description Ecosystem Rewards 10 million HPL tokens received from HyperLend in connection with the Company’s executed partnership agreements in March 2026, recorded on each end-of-day value when received. DeFi Monetization DeFi Monetization partnerships in connection with the Company’s temporary HYPE token use agreements plus third-party fees accrued in connection with yield enhancement activity. Yield Enhancement The Company’s first-party yield enhancement activity, including within the Hyperion Rysk Vault, and excluding third-party fees. Validator Commissions The Company’s portion of accrued net validator commissions from the Kinetiq x Hyperion Hyperliquid Validator, which are earned in HYPE and expressed as US dollars. Staking Yield The Company’s first-party Staking Yield on HYPE and HYPE LSTs* earned in HYPE and presented in US dollars. |
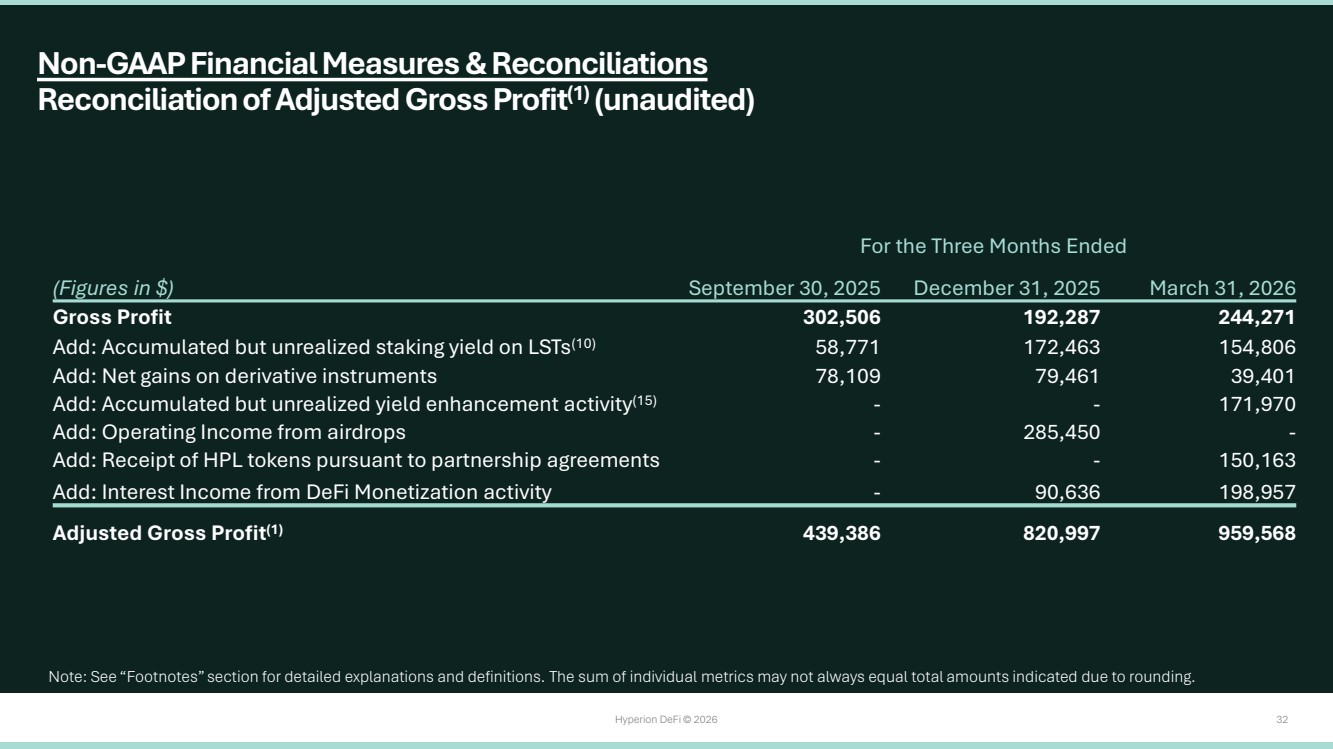
| Hyperion DeFi © 2026 32 Non-GAAP Financial Measures & Reconciliations Reconciliation of Adjusted Gross Profit(1) (unaudited) Note: See “Footnotes” section for detailed explanations and definitions. The sum of individual metrics may not always equal total amounts indicated due to rounding. For the Three Months Ended (Figures in $) September 30, 2025 December 31, 2025 March 31, 2026 Gross Profit 302,506 192,287 244,271 Add: Accumulated but unrealized staking yield on LSTs(10) 58,771 172,463 154,806 Add: Net gains on derivative instruments 78,109 79,461 39,401 Add: Accumulated but unrealized yield enhancement activity(15) - - 171,970 Add: Operating Income from airdrops - 285,450 - Add: Receipt of HPL tokens pursuant to partnership agreements - - 150,163 Add: Interest Income from DeFi Monetization activity - 90,636 198,957 Adjusted Gross Profit(1) 439,386 820,997 959,568 |
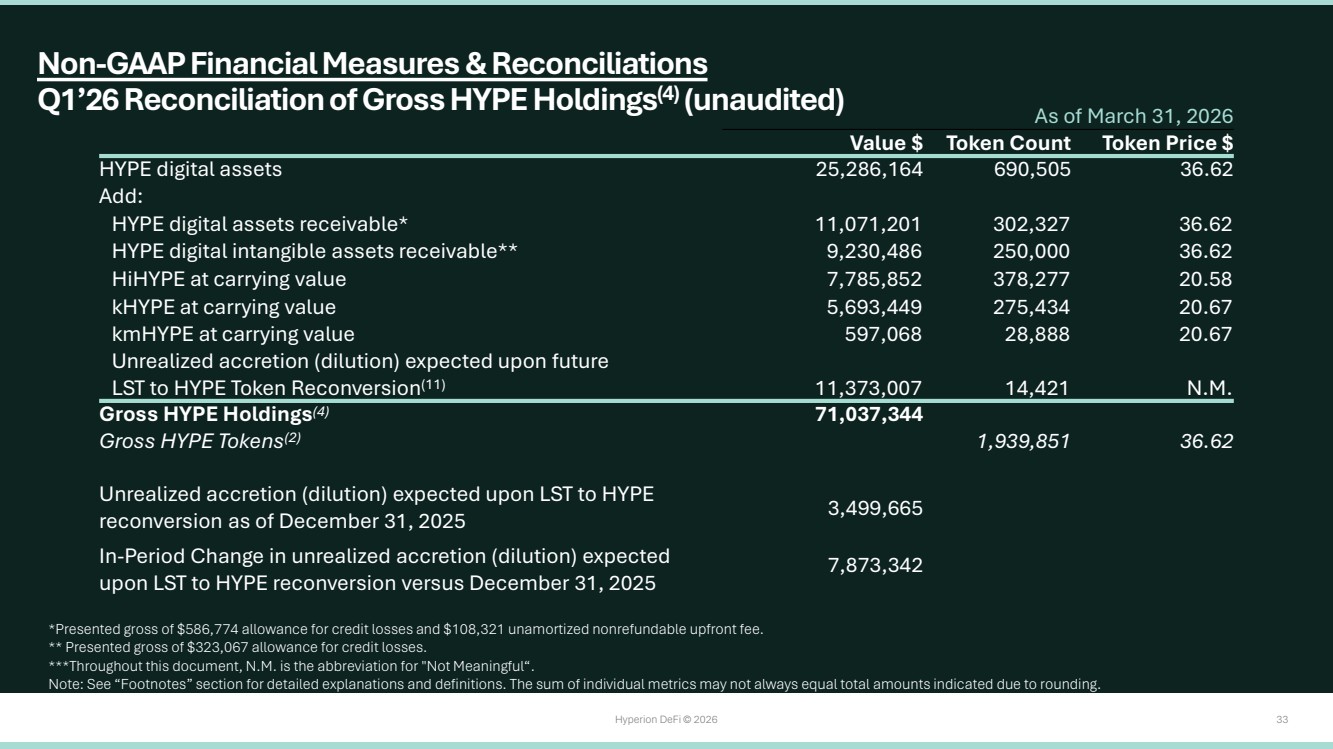
| Hyperion DeFi © 2026 33 As of March 31, 2026 Value $ Token Count Token Price $ HYPE digital assets 25,286,164 690,505 36.62 Add: HYPE digital assets receivable* 11,071,201 302,327 36.62 HYPE digital intangible assets receivable** 9,230,486 250,000 36.62 HiHYPE at carrying value 7,785,852 378,277 20.58 kHYPE at carrying value 5,693,449 275,434 20.67 kmHYPE at carrying value 597,068 28,888 20.67 Unrealized accretion (dilution) expected upon future LST to HYPE Token Reconversion(11) 11,373,007 14,421 N.M. Gross HYPE Holdings(4) 71,037,344 Gross HYPE Tokens(2) 1,939,851 36.62 Unrealized accretion (dilution) expected upon LST to HYPE reconversion as of December 31, 2025 3,499,665 In-Period Change in unrealized accretion (dilution) expected upon LST to HYPE reconversion versus December 31, 2025 7,873,342 *Presented gross of $586,774 allowance for credit losses and $108,321 unamortized nonrefundable upfront fee. ** Presented gross of $323,067 allowance for credit losses. ***Throughout this document, N.M. is the abbreviation for "Not Meaningful“. Note: See “Footnotes” section for detailed explanations and definitions. The sum of individual metrics may not always equal total amounts indicated due to rounding. Non-GAAP Financial Measures & Reconciliations Q1’26 Reconciliation of Gross HYPE Holdings(4) (unaudited) |
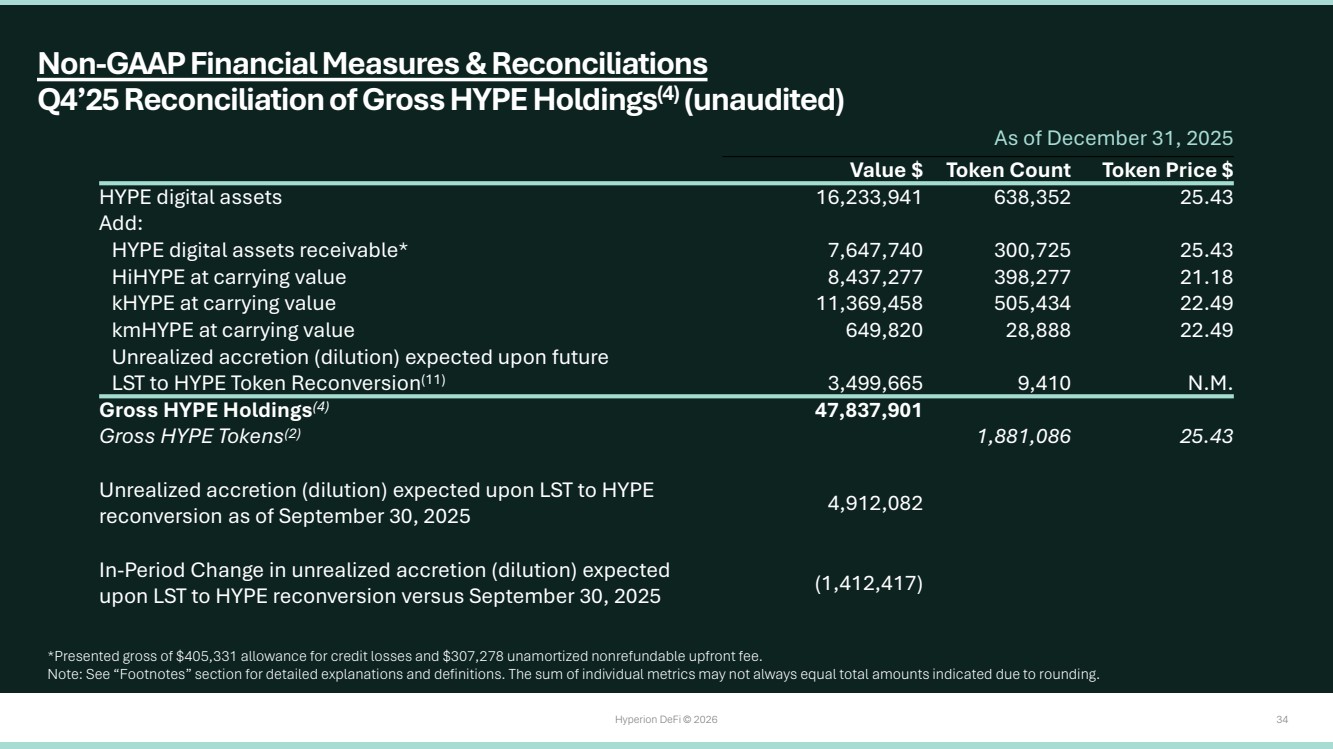
| Hyperion DeFi © 2026 34 As of December 31, 2025 Value $ Token Count Token Price $ HYPE digital assets 16,233,941 638,352 25.43 Add: HYPE digital assets receivable* 7,647,740 300,725 25.43 HiHYPE at carrying value 8,437,277 398,277 21.18 kHYPE at carrying value 11,369,458 505,434 22.49 kmHYPE at carrying value 649,820 28,888 22.49 Unrealized accretion (dilution) expected upon future LST to HYPE Token Reconversion(11) 3,499,665 9,410 N.M. Gross HYPE Holdings(4) 47,837,901 Gross HYPE Tokens(2) 1,881,086 25.43 Unrealized accretion (dilution) expected upon LST to HYPE reconversion as of September 30, 2025 4,912,082 In-Period Change in unrealized accretion (dilution) expected upon LST to HYPE reconversion versus September 30, 2025 (1,412,417) *Presented gross of $405,331 allowance for credit losses and $307,278 unamortized nonrefundable upfront fee. Note: See “Footnotes” section for detailed explanations and definitions. The sum of individual metrics may not always equal total amounts indicated due to rounding. Non-GAAP Financial Measures & Reconciliations Q4’25 Reconciliation of Gross HYPE Holdings(4) (unaudited) |
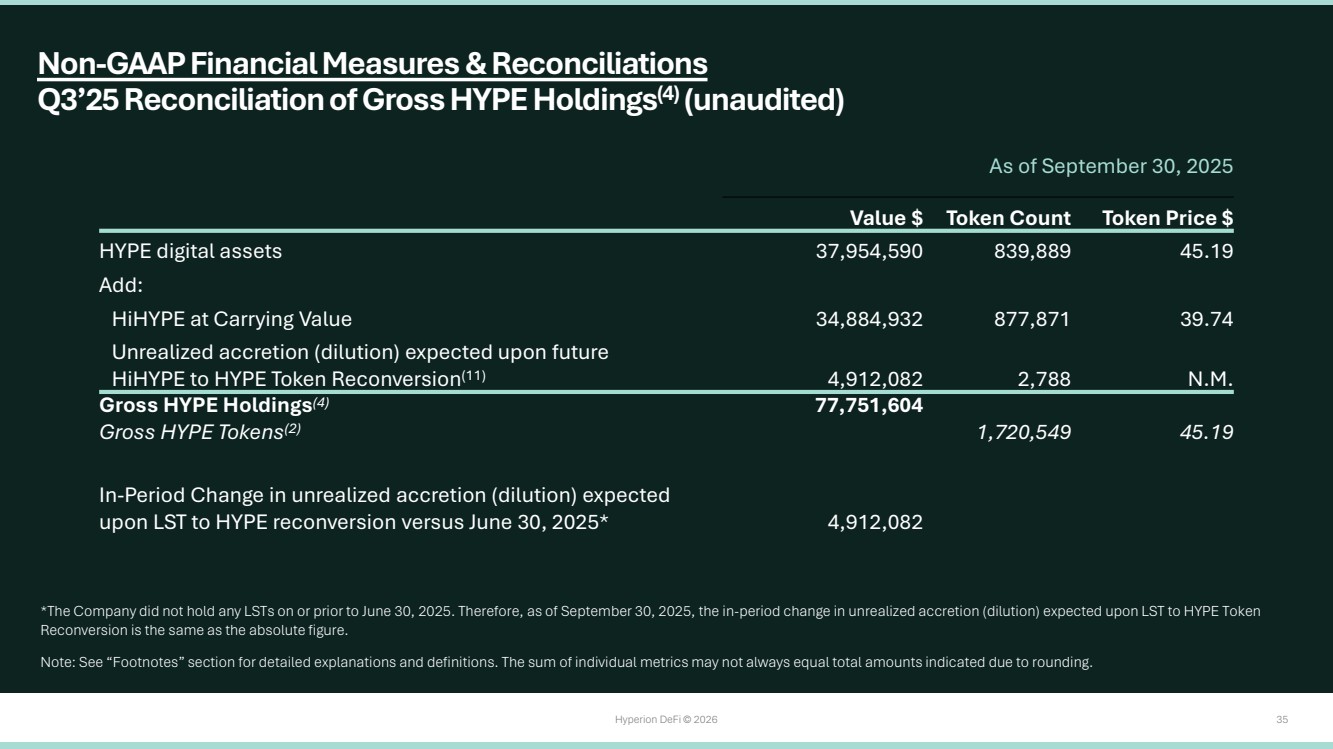
| Hyperion DeFi © 2026 35 Non-GAAP Financial Measures & Reconciliations Q3’25 Reconciliation of Gross HYPE Holdings(4) (unaudited) *The Company did not hold any LSTs on or prior to June 30, 2025. Therefore, as of September 30, 2025, the in-period change in unrealized accretion (dilution) expected upon LST to HYPE Token Reconversion is the same as the absolute figure. Note: See “Footnotes” section for detailed explanations and definitions. The sum of individual metrics may not always equal total amounts indicated due to rounding. As of September 30, 2025 Value $ Token Count Token Price $ HYPE digital assets 37,954,590 839,889 45.19 Add: HiHYPE at Carrying Value 34,884,932 877,871 39.74 Unrealized accretion (dilution) expected upon future HiHYPE to HYPE Token Reconversion(11) 4,912,082 2,788 N.M. Gross HYPE Holdings(4) 77,751,604 Gross HYPE Tokens(2) 1,720,549 45.19 In-Period Change in unrealized accretion (dilution) expected upon LST to HYPE reconversion versus June 30, 2025* 4,912,082 |
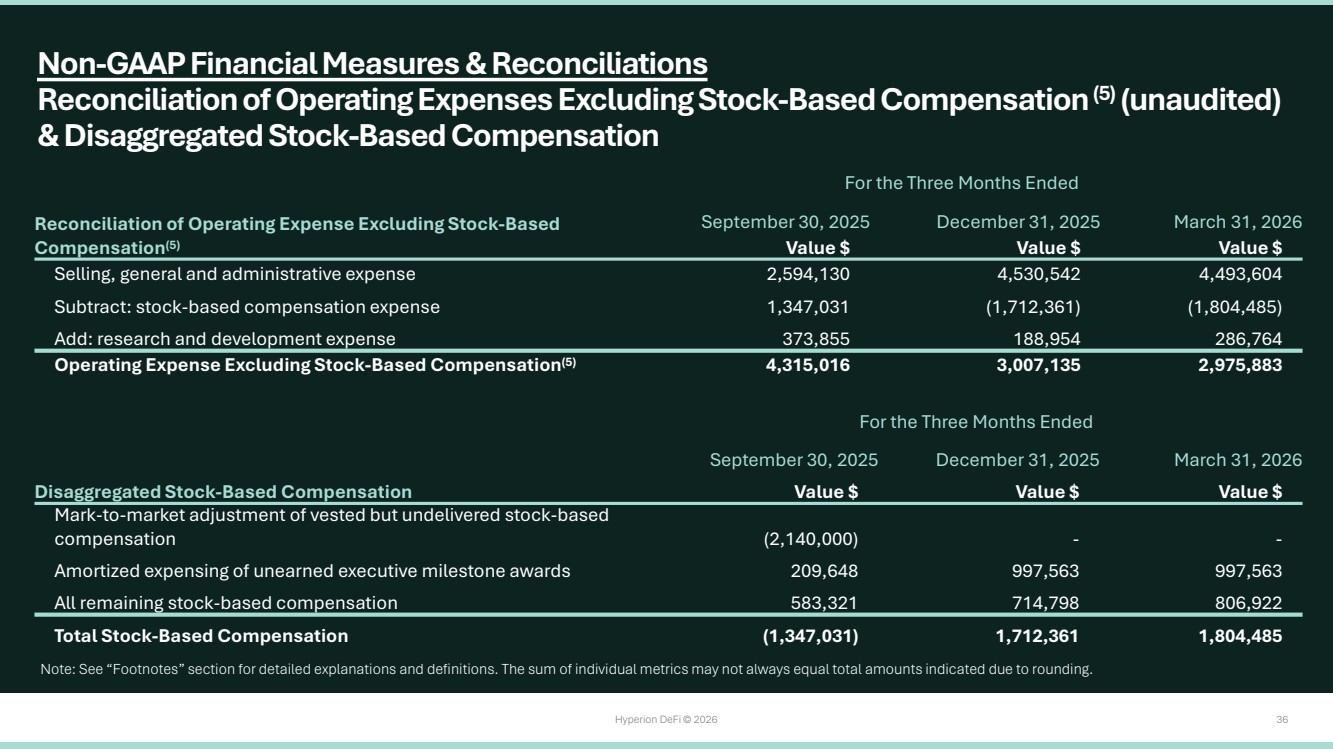
| Hyperion DeFi © 2026 36 Reconciliation of Operating Expense Excluding Stock-Based Compensation(5) For the Three Months Ended September 30, 2025 December 31, 2025 March 31, 2026 Value $ Value $ Value $ Selling, general and administrative expense 2,594,130 4,530,542 4,493,604 Subtract: stock-based compensation expense 1,347,031 (1,712,361) (1,804,485) Add: research and development expense 373,855 188,954 286,764 Operating Expense Excluding Stock-Based Compensation(5) 4,315,016 3,007,135 2,975,883 Non-GAAP Financial Measures & Reconciliations Reconciliation of Operating Expenses Excluding Stock-Based Compensation (5) (unaudited) & Disaggregated Stock-Based Compensation Note: See “Footnotes” section for detailed explanations and definitions. The sum of individual metrics may not always equal total amounts indicated due to rounding. Disaggregated Stock-Based Compensation For the Three Months Ended September 30, 2025 December 31, 2025 March 31, 2026 Value $ Value $ Value $ Mark-to-market adjustment of vested but undelivered stock-based compensation (2,140,000) - - Amortized expensing of unearned executive milestone awards 209,648 997,563 997,563 All remaining stock-based compensation 583,321 714,798 806,922 Total Stock-Based Compensation (1,347,031) 1,712,361 1,804,485 |
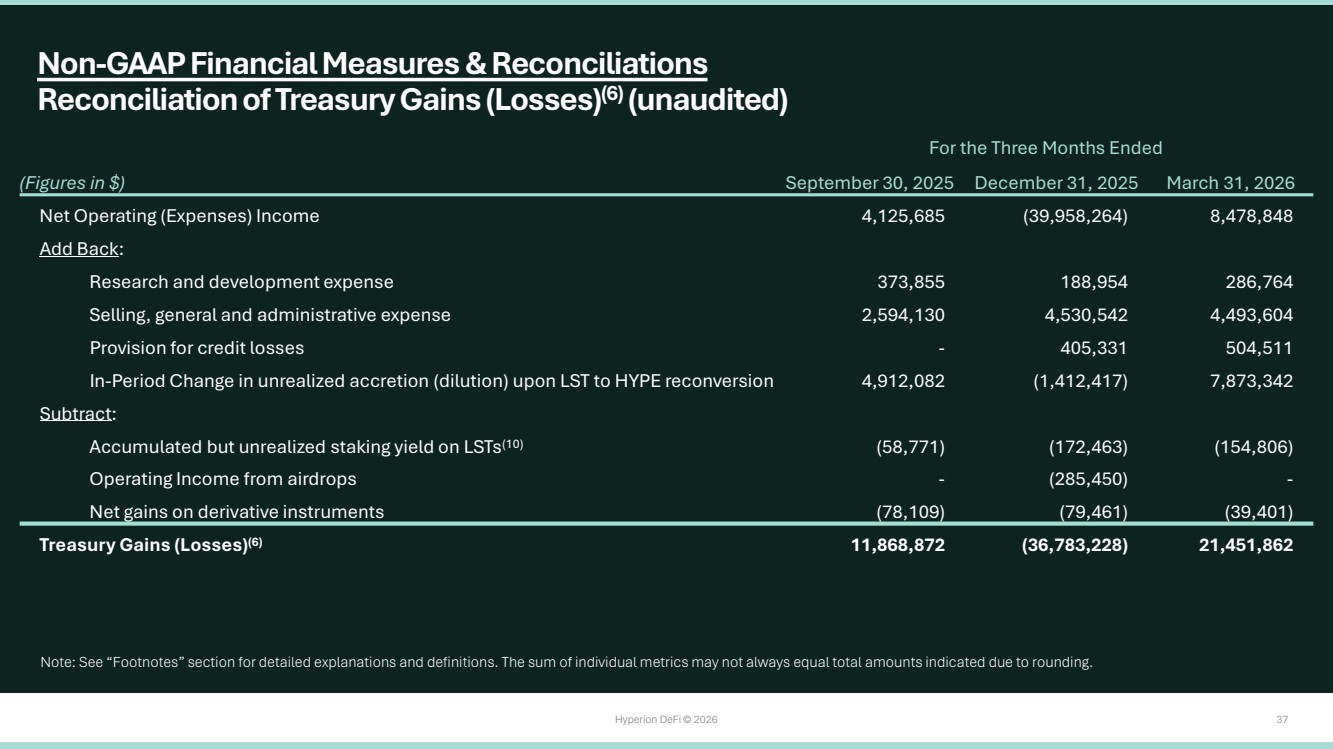
| Hyperion DeFi © 2026 37 (Figures in $) For the Three Months Ended September 30, 2025 December 31, 2025 March 31, 2026 Net Operating (Expenses) Income 4,125,685 (39,958,264) 8,478,848 Add Back: Research and development expense 373,855 188,954 286,764 Selling, general and administrative expense 2,594,130 4,530,542 4,493,604 Provision for credit losses - 405,331 504,511 In-Period Change in unrealized accretion (dilution) upon LST to HYPE reconversion 4,912,082 (1,412,417) 7,873,342 Subtract: Accumulated but unrealized staking yield on LSTs(10) (58,771) (172,463) (154,806) Operating Income from airdrops - (285,450) - Net gains on derivative instruments (78,109) (79,461) (39,401) Treasury Gains (Losses)(6) 11,868,872 (36,783,228) 21,451,862 Non-GAAP Financial Measures & Reconciliations Reconciliation of Treasury Gains (Losses)(6) (unaudited) Note: See “Footnotes” section for detailed explanations and definitions. The sum of individual metrics may not always equal total amounts indicated due to rounding. |
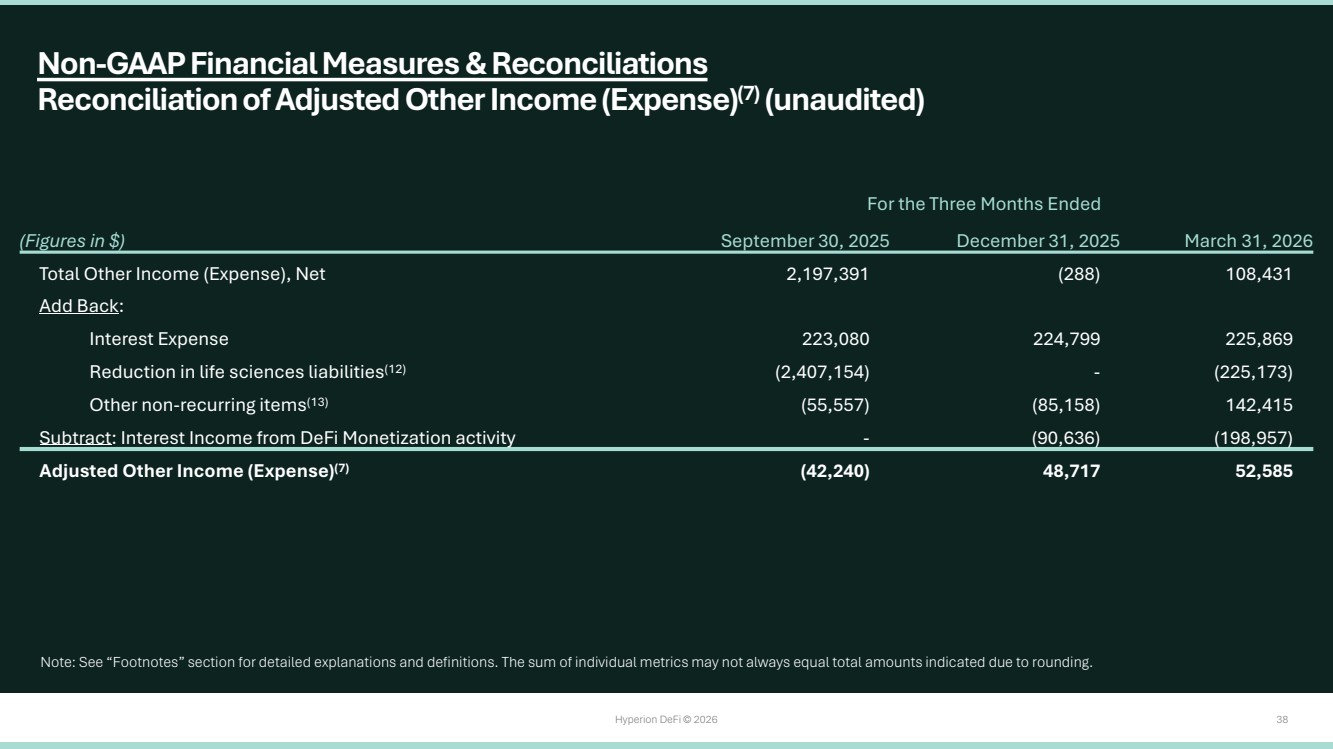
| Hyperion DeFi © 2026 38 (Figures in $) For the Three Months Ended September 30, 2025 December 31, 2025 March 31, 2026 Total Other Income (Expense), Net 2,197,391 (288) 108,431 Add Back: Interest Expense 223,080 224,799 225,869 Reduction in life sciences liabilities(12) (2,407,154) - (225,173) Other non-recurring items(13) (55,557) (85,158) 142,415 Subtract: Interest Income from DeFi Monetization activity - (90,636) (198,957) Adjusted Other Income (Expense)(7) (42,240) 48,717 52,585 Non-GAAP Financial Measures & Reconciliations Reconciliation of Adjusted Other Income (Expense)(7) (unaudited) Note: See “Footnotes” section for detailed explanations and definitions. The sum of individual metrics may not always equal total amounts indicated due to rounding. |
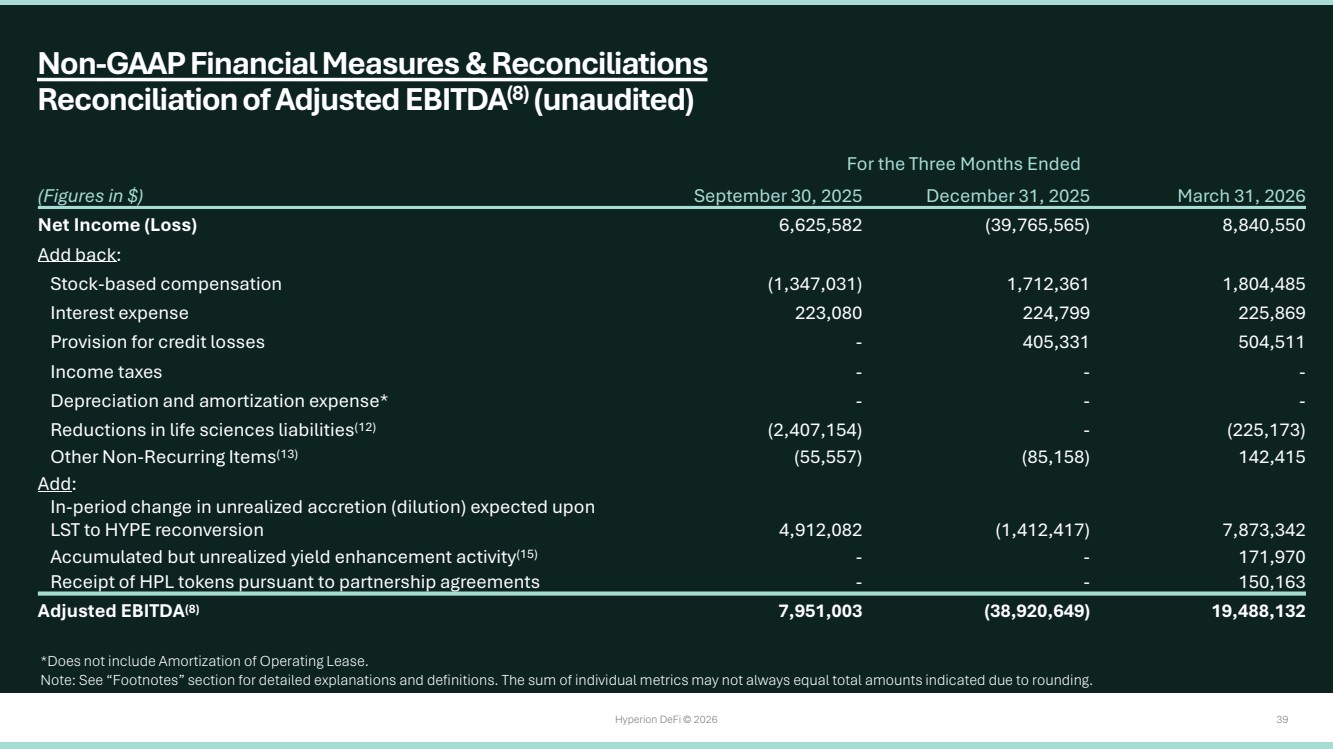
| Hyperion DeFi © 2026 39 (Figures in $) For the Three Months Ended September 30, 2025 December 31, 2025 March 31, 2026 Net Income (Loss) 6,625,582 (39,765,565) 8,840,550 Add back: Stock-based compensation (1,347,031) 1,712,361 1,804,485 Interest expense 223,080 224,799 225,869 Provision for credit losses - 405,331 504,511 Income taxes - - - Depreciation and amortization expense* - - - Reductions in life sciences liabilities(12) (2,407,154) - (225,173) Other Non-Recurring Items(13) (55,557) (85,158) 142,415 Add: In-period change in unrealized accretion (dilution) expected upon LST to HYPE reconversion 4,912,082 (1,412,417) 7,873,342 Accumulated but unrealized yield enhancement activity(15) - - 171,970 Receipt of HPL tokens pursuant to partnership agreements - - 150,163 Adjusted EBITDA(8) 7,951,003 (38,920,649) 19,488,132 Non-GAAP Financial Measures & Reconciliations Reconciliation of Adjusted EBITDA(8) (unaudited) *Does not include Amortization of Operating Lease. Note: See “Footnotes” section for detailed explanations and definitions. The sum of individual metrics may not always equal total amounts indicated due to rounding. |
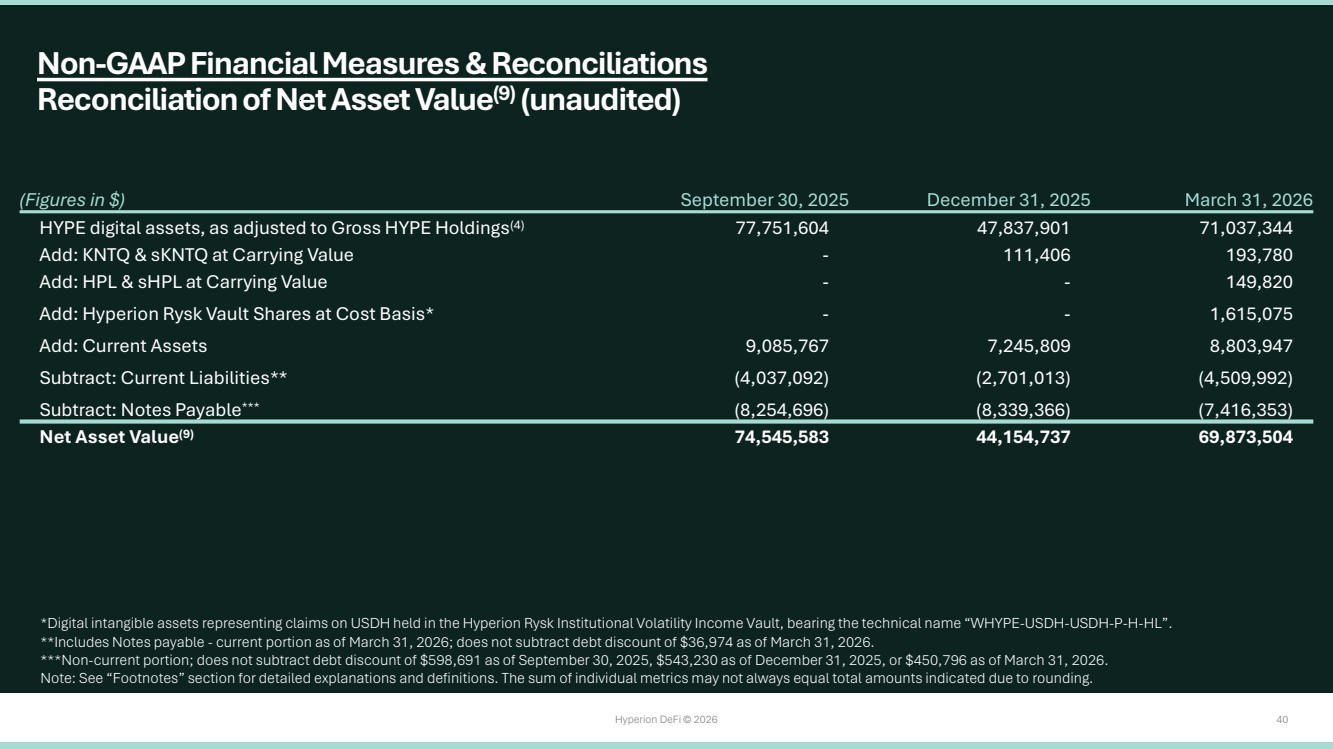
| Hyperion DeFi © 2026 40 (Figures in $) September 30, 2025 December 31, 2025 March 31, 2026 HYPE digital assets, as adjusted to Gross HYPE Holdings(4) 77,751,604 47,837,901 71,037,344 Add: KNTQ & sKNTQ at Carrying Value - 111,406 193,780 Add: HPL & sHPL at Carrying Value - - 149,820 Add: Hyperion Rysk Vault Shares at Cost Basis* - - 1,615,075 Add: Current Assets 9,085,767 7,245,809 8,803,947 Subtract: Current Liabilities** (4,037,092) (2,701,013) (4,509,992) Subtract: Notes Payable*** (8,254,696) (8,339,366) (7,416,353) Net Asset Value(9) 74,545,583 44,154,737 69,873,504 Non-GAAP Financial Measures & Reconciliations Reconciliation of Net Asset Value(9) (unaudited) *Digital intangible assets representing claims on USDH held in the Hyperion Rysk Institutional Volatility Income Vault, bearing the technical name “WHYPE-USDH-USDH-P-H-HL”. **Includes Notes payable - current portion as of March 31, 2026; does not subtract debt discount of $36,974 as of March 31, 2026. ***Non-current portion; does not subtract debt discount of $598,691 as of September 30, 2025, $543,230 as of December 31, 2025, or $450,796 as of March 31, 2026. Note: See “Footnotes” section for detailed explanations and definitions. The sum of individual metrics may not always equal total amounts indicated due to rounding. |
| Hyperion DeFi © 2026 41 Footnotes |
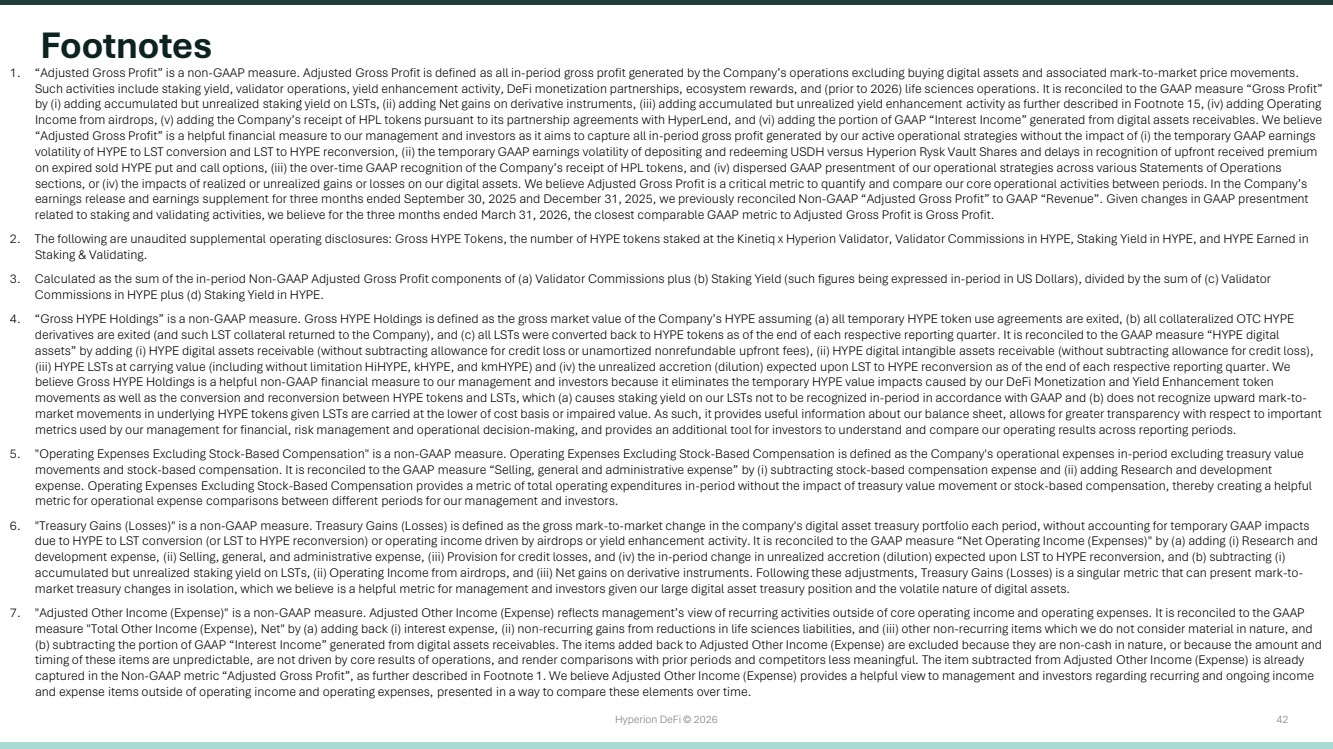
| Hyperion DeFi © 2026 42 Footnotes 1. “Adjusted Gross Profit” is a non-GAAP measure. Adjusted Gross Profit is defined as all in-period gross profit generated by the Company’s operations excluding buying digital assets and associated mark-to-market price movements. Such activities include staking yield, validator operations, yield enhancement activity, DeFi monetization partnerships, ecosystem rewards, and (prior to 2026) life sciences operations. It is reconciled to the GAAP measure “Gross Profit” by (i) adding accumulated but unrealized staking yield on LSTs, (ii) adding Net gains on derivative instruments, (iii) adding accumulated but unrealized yield enhancement activity as further described in Footnote 15, (iv) adding Operating Income from airdrops, (v) adding the Company’s receipt of HPL tokens pursuant to its partnership agreements with HyperLend, and (vi) adding the portion of GAAP “Interest Income” generated from digital assets receivables. We believe “Adjusted Gross Profit” is a helpful financial measure to our management and investors as it aims to capture all in-period gross profit generated by our active operational strategies without the impact of (i) the temporary GAAP earnings volatility of HYPE to LST conversion and LST to HYPE reconversion, (ii) the temporary GAAP earnings volatility of depositing and redeeming USDH versus Hyperion Rysk Vault Shares and delays in recognition of upfront received premium on expired sold HYPE put and call options, (iii) the over-time GAAP recognition of the Company’s receipt of HPL tokens, and (iv) dispersed GAAP presentment of our operational strategies across various Statements of Operations sections, or (iv) the impacts of realized or unrealized gains or losses on our digital assets. We believe Adjusted Gross Profit is a critical metric to quantify and compare our core operational activities between periods. In the Company’s earnings release and earnings supplement for three months ended September 30, 2025 and December 31, 2025, we previously reconciled Non-GAAP “Adjusted Gross Profit” to GAAP “Revenue”. Given changes in GAAP presentment related to staking and validating activities, we believe for the three months ended March 31, 2026, the closest comparable GAAP metric to Adjusted Gross Profit is Gross Profit. 2. The following are unaudited supplemental operating disclosures: Gross HYPE Tokens, the number of HYPE tokens staked at the Kinetiq x Hyperion Validator, Validator Commissions in HYPE, Staking Yield in HYPE, and HYPE Earned in Staking & Validating. 3. Calculated as the sum of the in-period Non-GAAP Adjusted Gross Profit components of (a) Validator Commissions plus (b) Staking Yield (such figures being expressed in-period in US Dollars), divided by the sum of (c) Validator Commissions in HYPE plus (d) Staking Yield in HYPE. 4. “Gross HYPE Holdings” is a non-GAAP measure. Gross HYPE Holdings is defined as the gross market value of the Company’s HYPE assuming (a) all temporary HYPE token use agreements are exited, (b) all collateralized OTC HYPE derivatives are exited (and such LST collateral returned to the Company), and (c) all LSTs were converted back to HYPE tokens as of the end of each respective reporting quarter. It is reconciled to the GAAP measure “HYPE digital assets” by adding (i) HYPE digital assets receivable (without subtracting allowance for credit loss or unamortized nonrefundable upfront fees), (ii) HYPE digital intangible assets receivable (without subtracting allowance for credit loss), (iii) HYPE LSTs at carrying value (including without limitation HiHYPE, kHYPE, and kmHYPE) and (iv) the unrealized accretion (dilution) expected upon LST to HYPE reconversion as of the end of each respective reporting quarter. We believe Gross HYPE Holdings is a helpful non-GAAP financial measure to our management and investors because it eliminates the temporary HYPE value impacts caused by our DeFi Monetization and Yield Enhancement token movements as well as the conversion and reconversion between HYPE tokens and LSTs, which (a) causes staking yield on our LSTs not to be recognized in-period in accordance with GAAP and (b) does not recognize upward mark-to-market movements in underlying HYPE tokens given LSTs are carried at the lower of cost basis or impaired value. As such, it provides useful information about our balance sheet, allows for greater transparency with respect to important metrics used by our management for financial, risk management and operational decision-making, and provides an additional tool for investors to understand and compare our operating results across reporting periods. 5. "Operating Expenses Excluding Stock-Based Compensation" is a non-GAAP measure. Operating Expenses Excluding Stock-Based Compensation is defined as the Company's operational expenses in-period excluding treasury value movements and stock-based compensation. It is reconciled to the GAAP measure “Selling, general and administrative expense” by (i) subtracting stock-based compensation expense and (ii) adding Research and development expense. Operating Expenses Excluding Stock-Based Compensation provides a metric of total operating expenditures in-period without the impact of treasury value movement or stock-based compensation, thereby creating a helpful metric for operational expense comparisons between different periods for our management and investors. 6. "Treasury Gains (Losses)" is a non-GAAP measure. Treasury Gains (Losses) is defined as the gross mark-to-market change in the company's digital asset treasury portfolio each period, without accounting for temporary GAAP impacts due to HYPE to LST conversion (or LST to HYPE reconversion) or operating income driven by airdrops or yield enhancement activity. It is reconciled to the GAAP measure “Net Operating Income (Expenses)" by (a) adding (i) Research and development expense, (ii) Selling, general, and administrative expense, (iii) Provision for credit losses, and (iv) the in-period change in unrealized accretion (dilution) expected upon LST to HYPE reconversion, and (b) subtracting (i) accumulated but unrealized staking yield on LSTs, (ii) Operating Income from airdrops, and (iii) Net gains on derivative instruments. Following these adjustments, Treasury Gains (Losses) is a singular metric that can present mark-to-market treasury changes in isolation, which we believe is a helpful metric for management and investors given our large digital asset treasury position and the volatile nature of digital assets. 7. "Adjusted Other Income (Expense)" is a non-GAAP measure. Adjusted Other Income (Expense) reflects management’s view of recurring activities outside of core operating income and operating expenses. It is reconciled to the GAAP measure "Total Other Income (Expense), Net" by (a) adding back (i) interest expense, (ii) non-recurring gains from reductions in life sciences liabilities, and (iii) other non-recurring items which we do not consider material in nature, and (b) subtracting the portion of GAAP “Interest Income” generated from digital assets receivables. The items added back to Adjusted Other Income (Expense) are excluded because they are non-cash in nature, or because the amount and timing of these items are unpredictable, are not driven by core results of operations, and render comparisons with prior periods and competitors less meaningful. The item subtracted from Adjusted Other Income (Expense) is already captured in the Non-GAAP metric “Adjusted Gross Profit”, as further described in Footnote 1. We believe Adjusted Other Income (Expense) provides a helpful view to management and investors regarding recurring and ongoing income and expense items outside of operating income and operating expenses, presented in a way to compare these elements over time. |
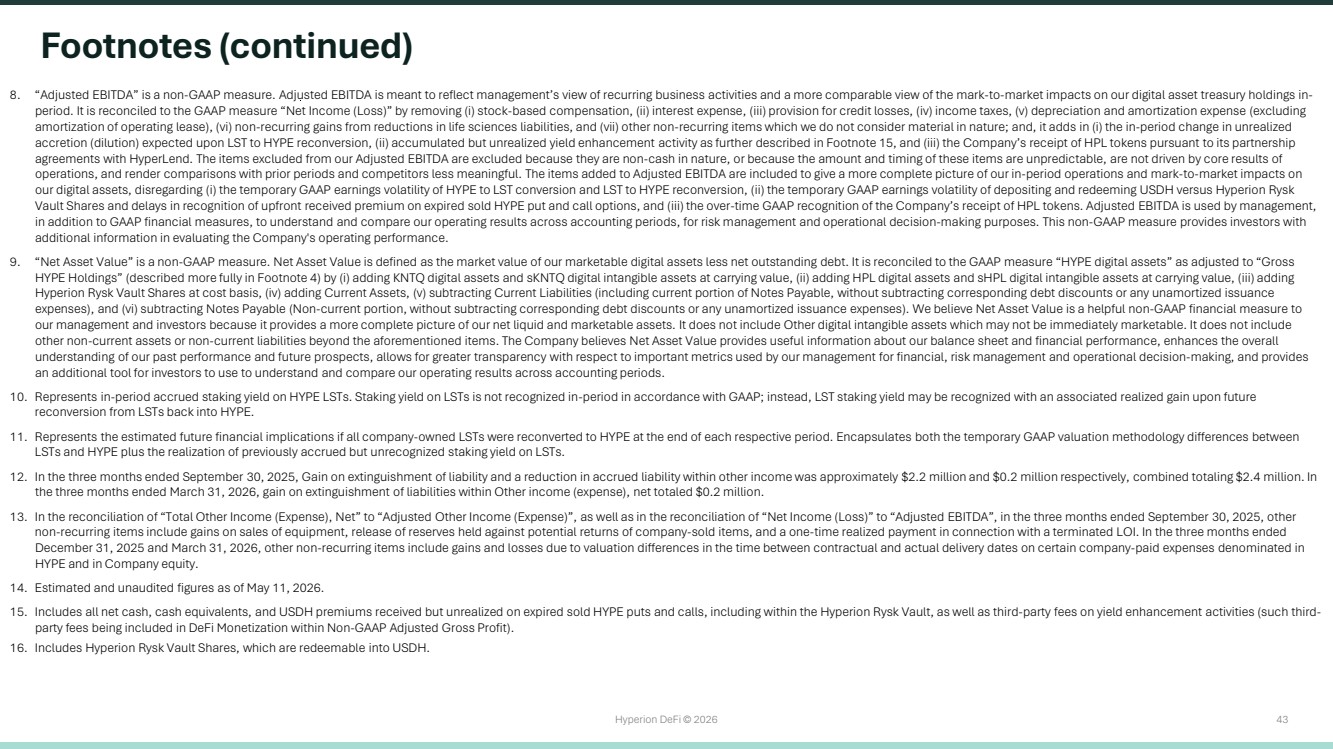
| Hyperion DeFi © 2026 43 Footnotes (continued) 8. “Adjusted EBITDA” is a non-GAAP measure. Adjusted EBITDA is meant to reflect management’s view of recurring business activities and a more comparable view of the mark-to-market impacts on our digital asset treasury holdings in-period. It is reconciled to the GAAP measure “Net Income (Loss)” by removing (i) stock-based compensation, (ii) interest expense, (iii) provision for credit losses, (iv) income taxes, (v) depreciation and amortization expense (excluding amortization of operating lease), (vi) non-recurring gains from reductions in life sciences liabilities, and (vii) other non-recurring items which we do not consider material in nature; and, it adds in (i) the in-period change in unrealized accretion (dilution) expected upon LST to HYPE reconversion, (ii) accumulated but unrealized yield enhancement activity as further described in Footnote 15, and (iii) the Company’s receipt of HPL tokens pursuant to its partnership agreements with HyperLend. The items excluded from our Adjusted EBITDA are excluded because they are non-cash in nature, or because the amount and timing of these items are unpredictable, are not driven by core results of operations, and render comparisons with prior periods and competitors less meaningful. The items added to Adjusted EBITDA are included to give a more complete picture of our in-period operations and mark-to-market impacts on our digital assets, disregarding (i) the temporary GAAP earnings volatility of HYPE to LST conversion and LST to HYPE reconversion, (ii) the temporary GAAP earnings volatility of depositing and redeeming USDH versus Hyperion Rysk Vault Shares and delays in recognition of upfront received premium on expired sold HYPE put and call options, and (iii) the over-time GAAP recognition of the Company’s receipt of HPL tokens. Adjusted EBITDA is used by management, in addition to GAAP financial measures, to understand and compare our operating results across accounting periods, for risk management and operational decision-making purposes. This non-GAAP measure provides investors with additional information in evaluating the Company's operating performance. 9. “Net Asset Value” is a non-GAAP measure. Net Asset Value is defined as the market value of our marketable digital assets less net outstanding debt. It is reconciled to the GAAP measure “HYPE digital assets” as adjusted to “Gross HYPE Holdings” (described more fully in Footnote 4) by (i) adding KNTQ digital assets and sKNTQ digital intangible assets at carrying value, (ii) adding HPL digital assets and sHPL digital intangible assets at carrying value, (iii) adding Hyperion Rysk Vault Shares at cost basis, (iv) adding Current Assets, (v) subtracting Current Liabilities (including current portion of Notes Payable, without subtracting corresponding debt discounts or any unamortized issuance expenses), and (vi) subtracting Notes Payable (Non-current portion, without subtracting corresponding debt discounts or any unamortized issuance expenses). We believe Net Asset Value is a helpful non-GAAP financial measure to our management and investors because it provides a more complete picture of our net liquid and marketable assets. It does not include Other digital intangible assets which may not be immediately marketable. It does not include other non-current assets or non-current liabilities beyond the aforementioned items. The Company believes Net Asset Value provides useful information about our balance sheet and financial performance, enhances the overall understanding of our past performance and future prospects, allows for greater transparency with respect to important metrics used by our management for financial, risk management and operational decision-making, and provides an additional tool for investors to use to understand and compare our operating results across accounting periods. 10. Represents in-period accrued staking yield on HYPE LSTs. Staking yield on LSTs is not recognized in-period in accordance with GAAP; instead, LST staking yield may be recognized with an associated realized gain upon future reconversion from LSTs back into HYPE. 11. Represents the estimated future financial implications if all company-owned LSTs were reconverted to HYPE at the end of each respective period. Encapsulates both the temporary GAAP valuation methodology differences between LSTs and HYPE plus the realization of previously accrued but unrecognized staking yield on LSTs. 12. In the three months ended September 30, 2025, Gain on extinguishment of liability and a reduction in accrued liability within other income was approximately $2.2 million and $0.2 million respectively, combined totaling $2.4 million. In the three months ended March 31, 2026, gain on extinguishment of liabilities within Other income (expense), net totaled $0.2 million. 13. In the reconciliation of “Total Other Income (Expense), Net” to “Adjusted Other Income (Expense)”, as well as in the reconciliation of “Net Income (Loss)” to “Adjusted EBITDA”, in the three months ended September 30, 2025, other non-recurring items include gains on sales of equipment, release of reserves held against potential returns of company-sold items, and a one-time realized payment in connection with a terminated LOI. In the three months ended December 31, 2025 and March 31, 2026, other non-recurring items include gains and losses due to valuation differences in the time between contractual and actual delivery dates on certain company-paid expenses denominated in HYPE and in Company equity. 14. Estimated and unaudited figures as of May 11, 2026. 15. Includes all net cash, cash equivalents, and USDH premiums received but unrealized on expired sold HYPE puts and calls, including within the Hyperion Rysk Vault, as well as third-party fees on yield enhancement activities (such third-party fees being included in DeFi Monetization within Non-GAAP Adjusted Gross Profit). 16. Includes Hyperion Rysk Vault Shares, which are redeemable into USDH. |